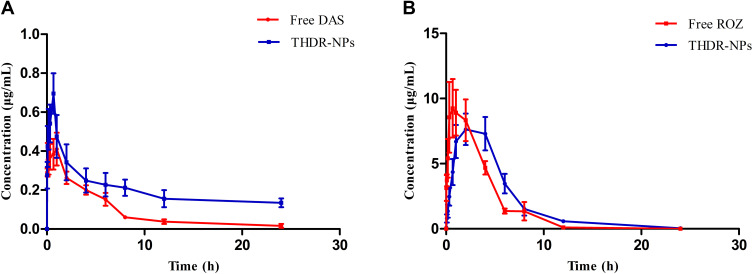
Figure 9.
The drug-time curve of SD rats after intraperitoneal injection of THDR-NPs and DAS+ROZ (n=5), the drug-time curve of DAS (A) and ROZ (B) in SD rats.
Notes: The results are expressed as the mean ± SD, n=3.
Abbreviations: DAS, dasatinib; ROZ, rosiglitazone; THDR-NPs, HA-DAS and TPGS mixed micelle system loaded with ROZ.

