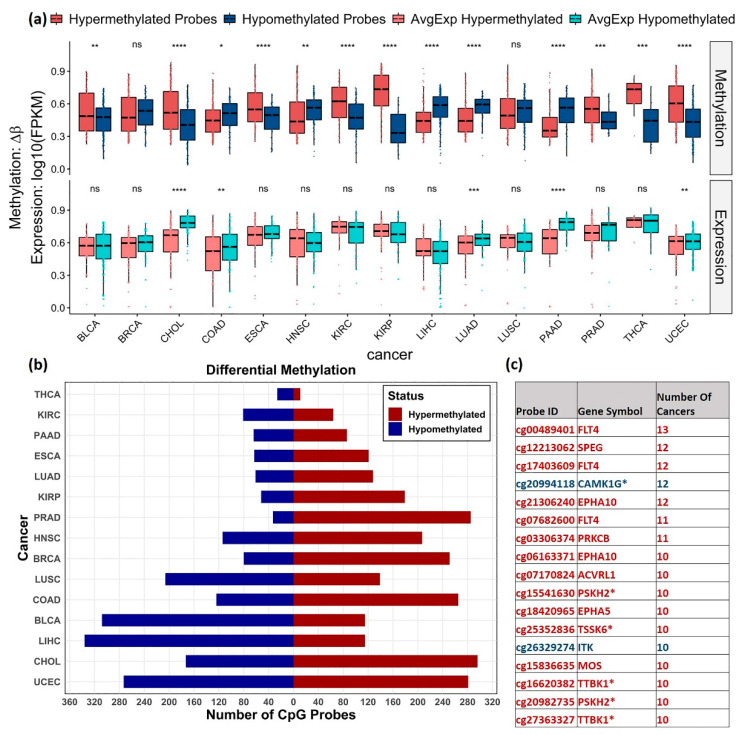
Figure 3.
Distribution of DM CpGs across cancers. (a) Box plots showing distribution of hyper (Red) and hypomethylated (blue) probes and the corresponding average gene expression (light red and light blue) in different cancers. The gene expression values were normalized between 0 and 1. T-test was used to show the significance level between the methylation levels of the hyper and hypo methylated probes and between the corresponding gene expression level (ns: p > 0.05, *: p ≤ 0.05, **: p ≤ 0.01, ***: p ≤ 0.001, ****: p ≤ 0.0001). CpG probes with mean β value difference of at least 0.2 (Δβ ≥ 0.2) at BH adjusted p-value < 0.05 were considered differentially methylated. (b) Distribution of hypermethylated (red) and hypomethylated (blue) probes obtained for each cancer. (c) List of commonly observed probes DM in ≥ 10 cancers, their direction of methylation (hypermethylation—red and hypomethylation—blue) and the number of cancers observed. Dark kinase genes are marked with * symbol.

