
Figure 5.
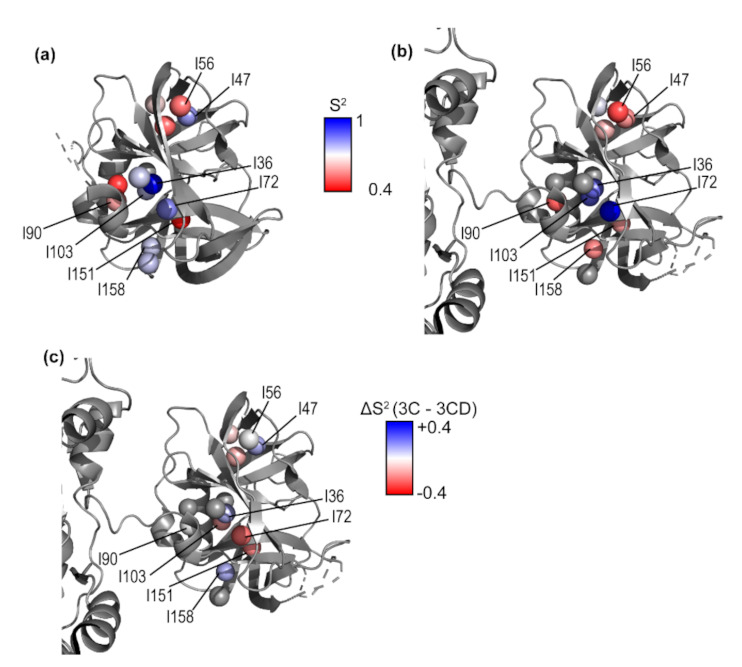
Methyl axis order parameters for 3C and the 3C domain in 3CD. Methyl axis order parameters are plotted as colored spheres ranging from 0.4–1 (red to blue) as indicated for (a) 3C and (b) 3C domain of 3CD. (c) Differences in methyl axis order parameters between 3C and 3CD (ΔS2 = S2 (3C) − S2 (3CD)) are plotted as colored spheres, ranging from −0.4 to +0.4 (red to blue).