
Figure 8.
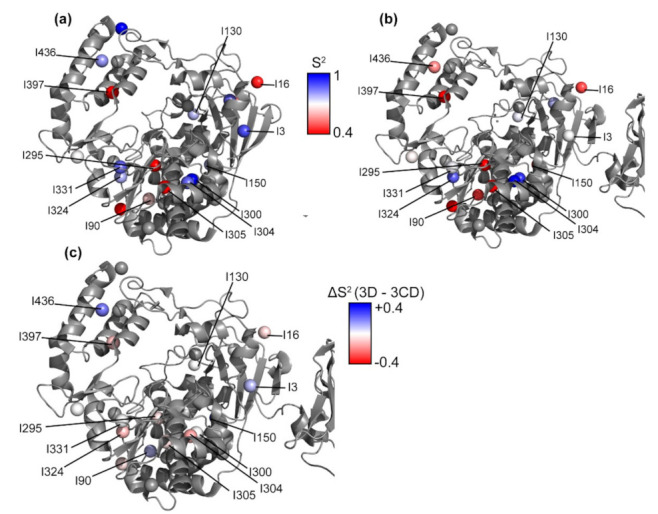
Methyl axis order parameters for 3D and the 3D domain in 3CD. Methyl axis order parameters are plotted as colored spheres ranging from 0.4–1 (red to blue) as indicated for (a) 3D and (b) 3D domain of 3CD. (c) Differences in methyl axis order parameters between 3D and 3CD (ΔS2 = S2 (3D) − S2 (3CD)) are plotted as colored spheres, ranging from −0.4 to +0.4 (red to blue). 3D numbering is used here for both 3D and the 3D domain in 3CD; to find the corresponding number in 3CD, the reader would need to add 183.