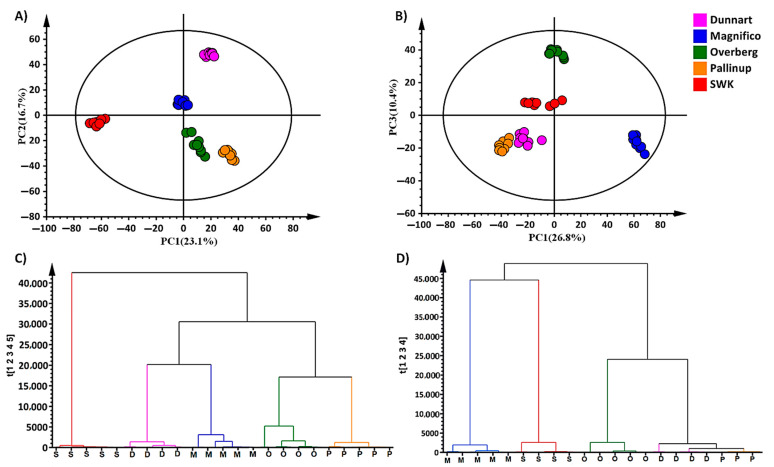
Figure 3.
Principal component analysis (PCA) of five oat cultivars with the corresponding hierarchical cluster analysis (HiCA) dendrograms. PCA score plots indicate the clustering and general grouping among the five cultivars (Overberg—O, Pallinup—P, Dunnart—D, Magnifico—M, and SWK001—S) extracted from (A) leaf and (B) root tissues, analysed in ESI(–) mode. The HiCA dendrogram (C) shows the hierarchical structure of the leaf data indicating that ‘Pallinup’ is phytochemically more similar to ‘Overberg’, and ‘Dunnart’ to ‘Magnifico’. In comparison, ‘SWK001’ is the most different from the other cultivars concerning their leaf metabolic profiles. The HiCA dendrogram (D) illustrates the root metabolic profiles; ‘Pallinup’ and ‘Dunnart’ are similar and cluster closely with ‘Overberg’. In comparison, ‘Magnifico’ and ‘SWK001’ are metabolically different from the other three cultivars based on the extracted profiles.

