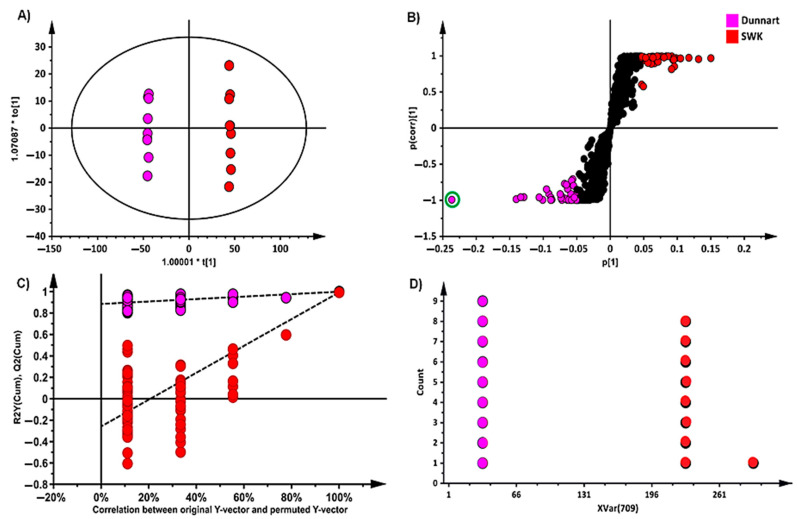
Figure 4.
An orthogonal projection to latent structures discriminant analysis (OPLS-DA) model of two representative cultivars: ‘Dunnart’ and ‘SWK001’. (A) A score plot summarising the relationship among different datasets to visualise group clustering between the ‘Dunnart’ and ‘SWK001’ cultivars based on their leaf-extracted metabolic profiles obtained in ESI (−) MS mode (R2 = 0.998, Q2 = 0.971, CV-ANOVA p-value = 5.8941 × 10⁻¹⁴). (B) The corresponding loadings S-plot. The pink and red circles indicate the outlier values (p(corr) [1] ≥0.5, ≤−0.5) and covariance of p [1] ≥0.05, ≤−0.05) in the S-plot, indicating statistically significant ions that are possible discriminatory variables between the two cultivars. (C) Permutation test plot (n = 100) for the OPLS-DA model (A) was used to validate the predictive capability. (D) Dot plot illustrating strong discrimination between the cultivars for the selected variable (circled in green on the S-plot) as there is no overlap between the groups.

