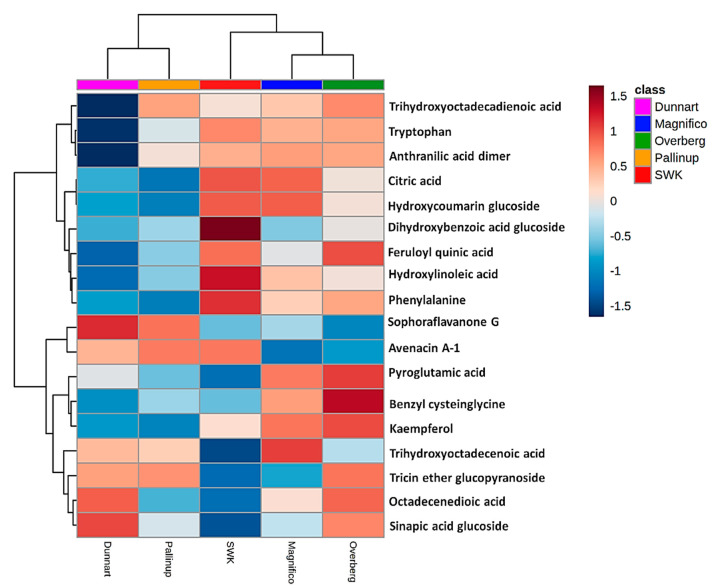
Figure 7.
Individual peak intensities of annotated metabolites from oat roots using heatmap analysis (Pearson distance and Ward’s linkage rule) of the five cultivars ‘Overberg’, ‘Pallinup’, ‘Dunnart’, ‘Magnifico’ and ‘SWK001’. The mean peak intensities of each annotated metabolite are shown after Pareto scaling of the data. Values higher than the averages are indicated in red and lower values in blue, with each row representing discriminant features and each column representing the respective cultivars.

