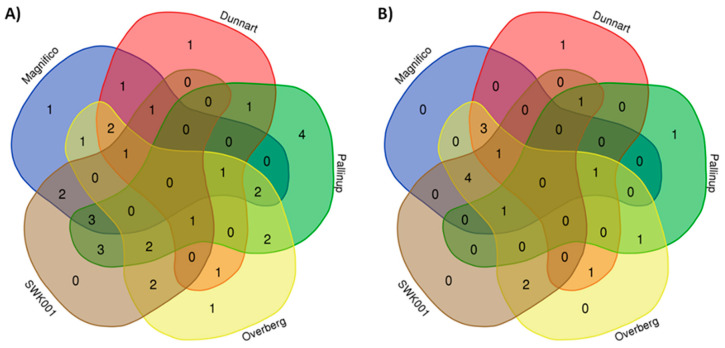
Figure 8.
Venn diagrams displaying the partial overlap and differences of statistically significant variables selected from the OPLS-DA models for (A) leaves and (B) roots. The numerical values in the diagram represent the discriminatory metabolites (Table 1) that are unique to the respective cultivars and, conversely, also shared between the cultivars.

