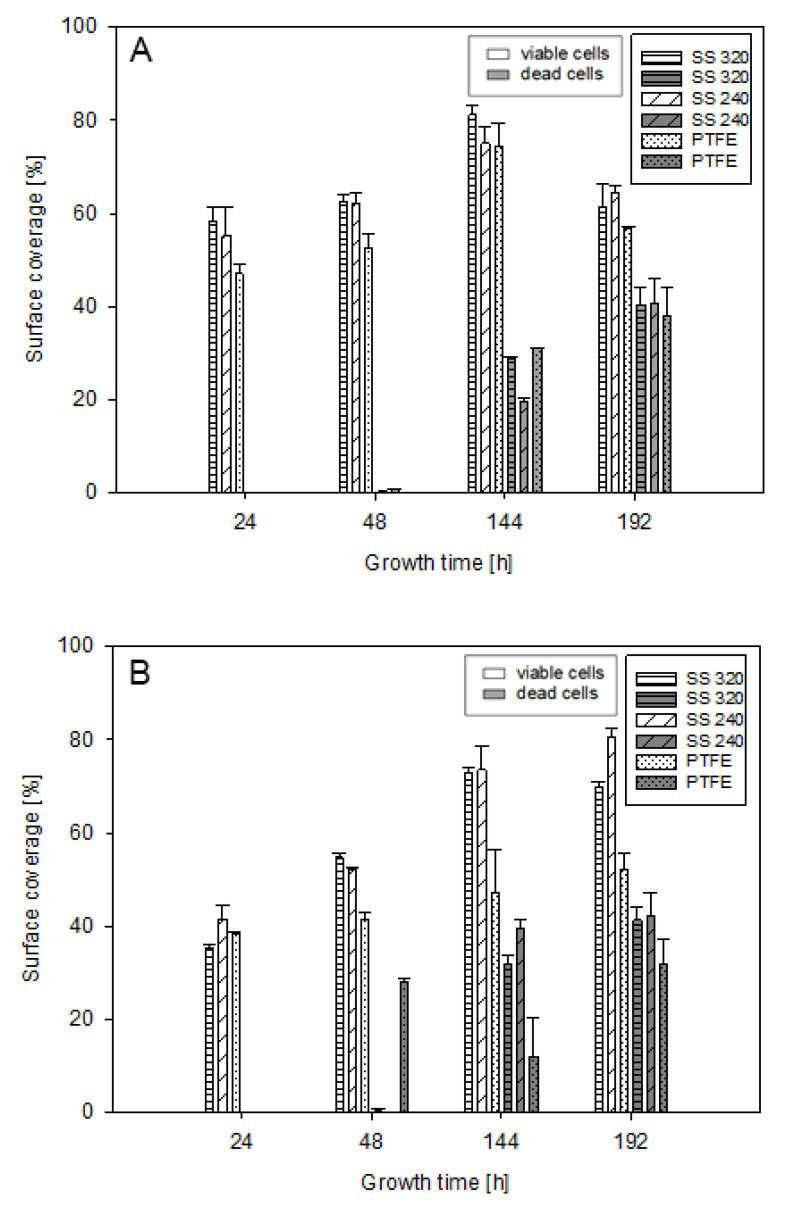
Figure 3.
M. lacticum (A) and S. capitis (B) surface coverage (%) at 24, 48, 144, and 192 h through cell staining with SYTOTM 9 and propidium iodide (PI) on PTFE and SS coupons. The proportion of viable (white bars; SYTOTM 9) and dead cells (grey bars; PI) is indicated. For image analysis, an area of 260 mm² was investigated.

