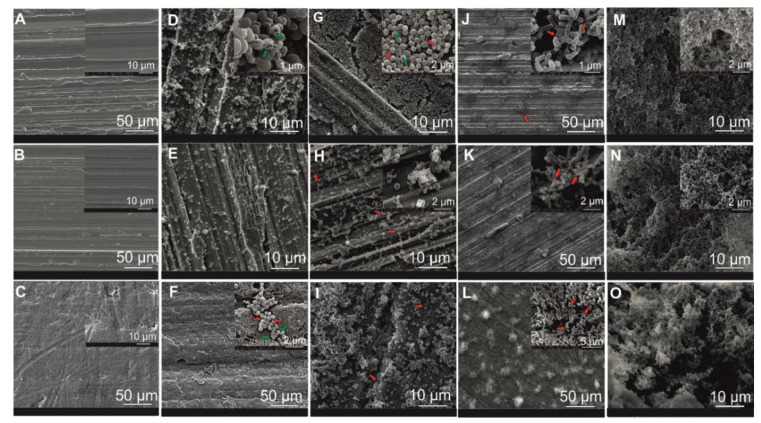
Figure 4.
Representative scanning electron microscopy (SEM) images of the reference surface materials SS 240 (A), SS 320 (B), PTFE (C), and the biofilm structure. S. capitis biofilm at 48 h on SS 240 (D), SS 320 (E), and PTFE (F) and at 192 h on SS 240 (G), SS 320 (H) and PTFE (I). M. lacticum biofilm at 48 h on SS 240 (J), SS 320 (K), PTFE (L), as well as at 192 h on SS 240 (M), SS 320 (N), and PTFE (O). The amorphous matrix (possibly an extracellular polymeric substance (EPS); red arrows) and membrane-compromised cells (green arrows) are visualized in color.

