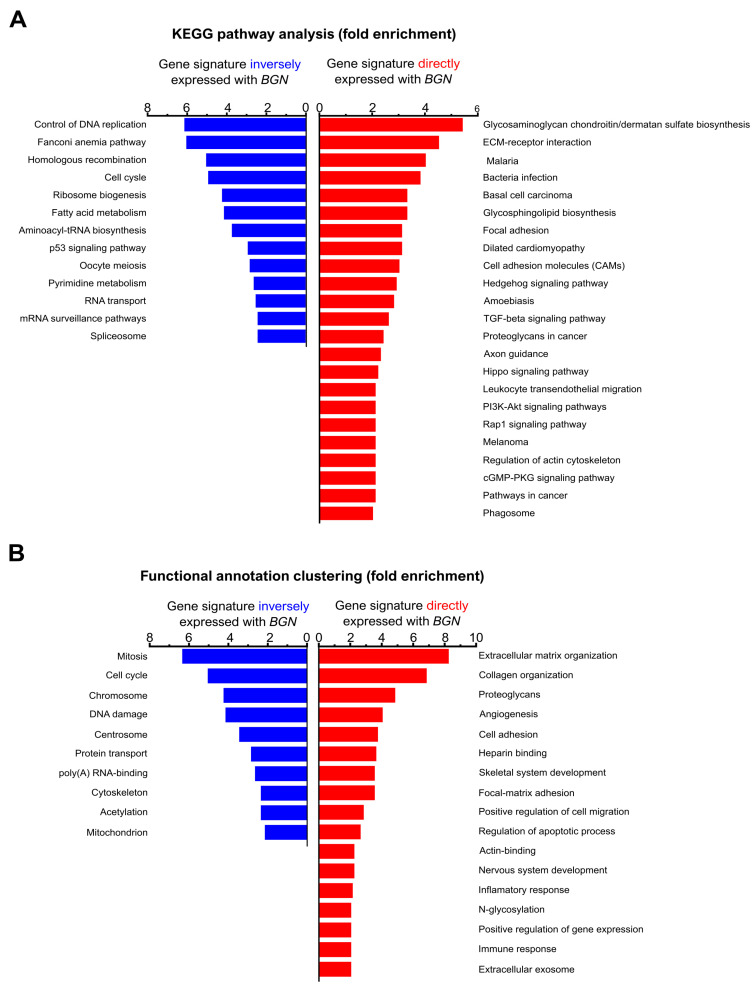
Figure 2.
Functional analysis of BGN (biglycan) gene expression in clinical GC samples. (A) KEGG pathway analysis of genes profiles inversely expressed with BGN (blue) or directly coexpressed with BGN (red). (B) Classification of BGN gene-associated profiles into functional processes using the DAVID classification system. A minimum two-fold threshold and a p value < 0.05 was considered.

