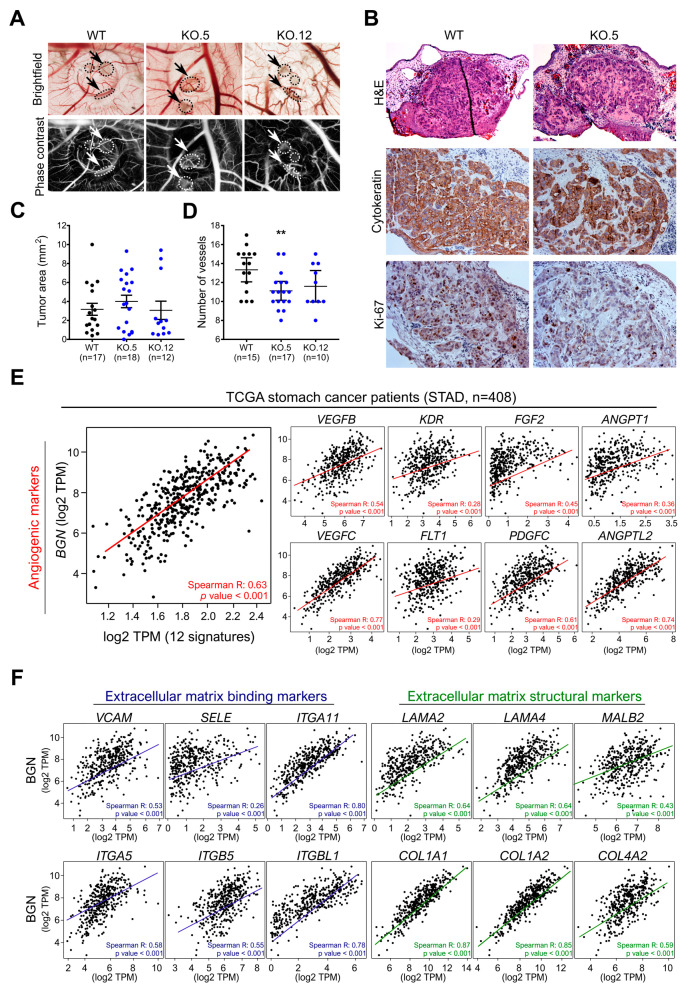
Figure 6.
Effect of biglycan in in vivo angiogenesis. (A) Representative images of tumors formed in the in vivo CAM by MKN74 cell models (WT and biglycan KO clones—KO.5 and KO.12). Phase contrast was used to better visualize tumor foci and vessels. MKN74 form multiple tumor foci (arrows/circles). Magnification at 20×. (B) Histological images of the formed tumors, cytokeratin staining confirming the presence of human epithelial tumors in the CAM. Ki-67 expression analysis was used to assess tumor aggressiveness. Histologically, tumors formed by KO cells present a less cohesive-like tumor mass with increased extracellular matrix stiffness. Hematoxilin & Eosin (H&E) staining images at 100X magnification, cytokeration and Ki-67 images at 200× magnification. (C) Quantification of the tumor area (mm2) with no significant differences in the tumors being derived from the different cell lines. (D) Number of new vessels (less than 20 μm in diameter) formed towards the inoculation site. biglycan KO inoculated cells showed less capacity to form new vessels when compared to WT biglycan-positive tumors. (E) In silico gene analysis in GC tissues samples (TCGA, n = 408) showing that BGN was strongly positively correlated with angiogenic markers (VEGFB, VEGFC, KDR, FLT1, FGF2, PDGFC, ANGPT1, ANGPT2, ANGPTL2, ANGPTL1, ANGPTL4, and ANGPTL7). (F) In silico analysis demonstrating that BGN is positively correlated with ECM binding (VCAM1, SELE, ITGA11, ITGA5, ITGB5, ITGBL1) and ECM structural (LAMA2, LAMA4, LAMB2, COL1A1, COL1A2, and COL4A2) genes in GC samples (TCGA, n = 408). Gene correlation was performed using the Gene Expression Profiling Interactive Analysis (GEPIA) program. **, p value < 0.01.

