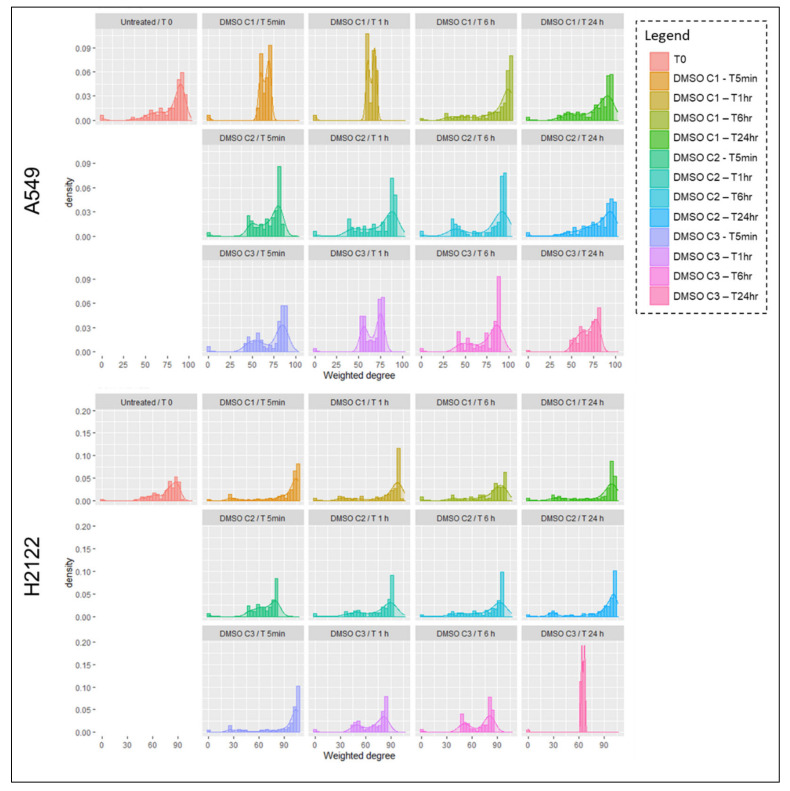
Figure 2.
Histograms and kernel density plots representing weighted Pearson’s correlation coefficients for each DMSO dose across timepoints for A549 and H2122. Weighted Pearson’s correlation coefficients were calculated for paired proteins across all measured analytes and the degree of distribution of pair-wise interconnections between analytes is shown for each cell lines, DMSO concentration, and timepoints.

