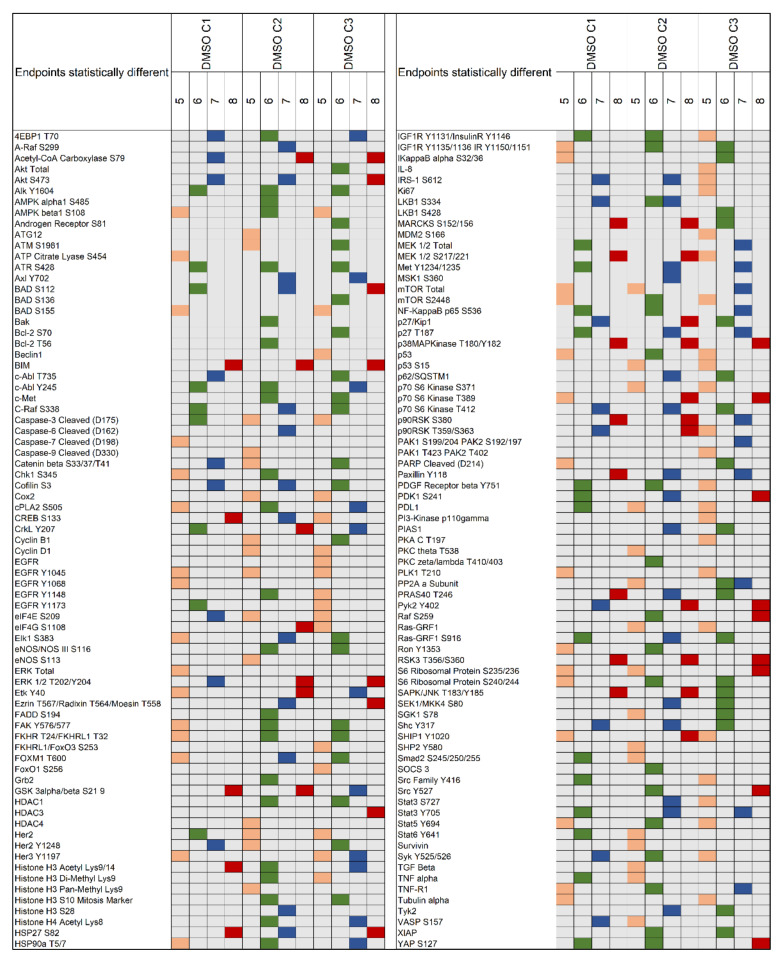
Figure 4.
For each cell line and DMSO concentration (C1 = 0.0008%, C2 = 0.002%, and C3 = 0.004%, respectively), a two-tailed Kruskal Wallis rank test was used to capture changes across timepoints (n = 5). Proteins that emerged as statistically significant in five (orange), six (green), seven (blue), or all eight (red) cell lines are shown in the matrix. A total of 150 proteins met the criteria and are displayed.

