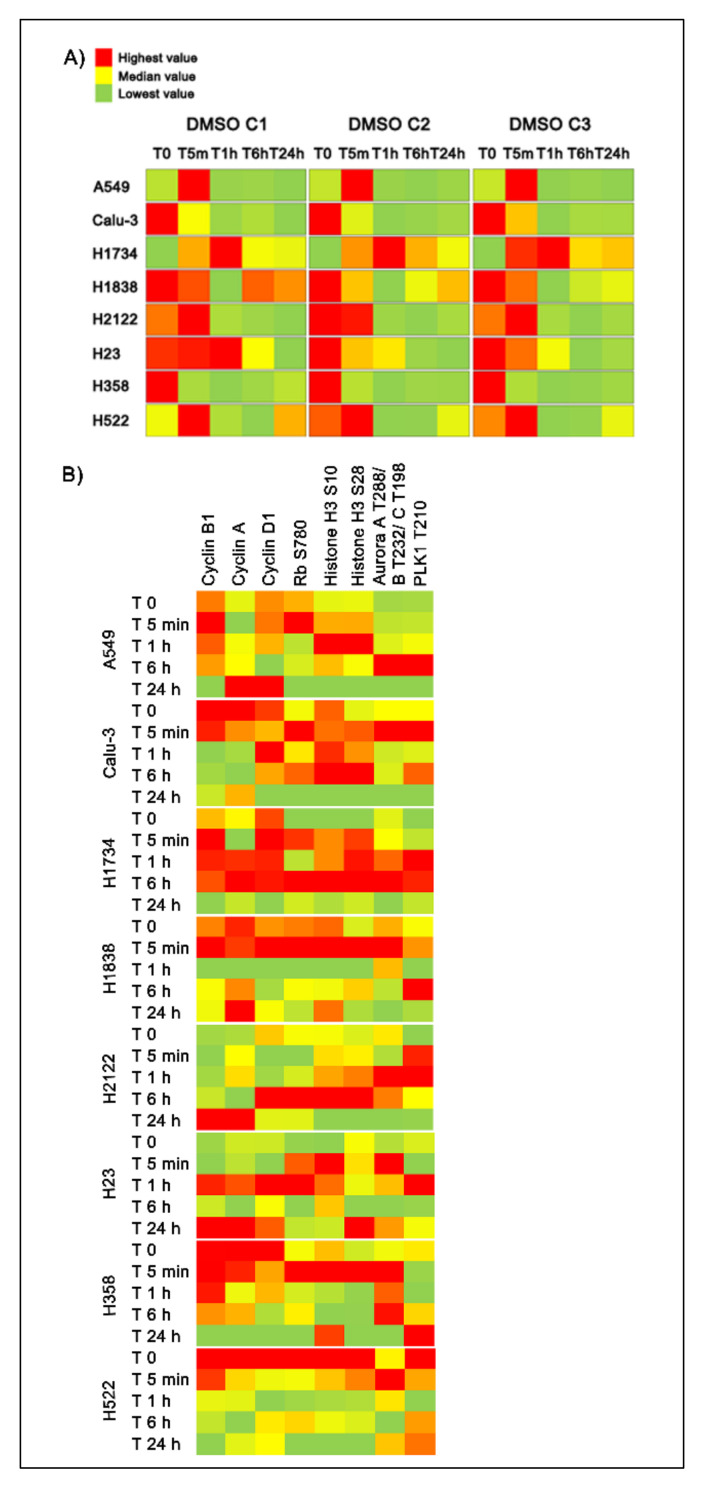
Figure 5.
Heatmaps displaying dose- and time-dependent changes in ERK 1/2 activation measured as phosphorylation of the T202/Y204 residues (Panel A) along with expression/activation levels of proteins involved in the cell cycle regulation (Panel B). Heatmaps capture average values (n = 3) across five timepoints for the three DMSO concentrations within each cell line using a red (highest) to green (lowest) scale.

