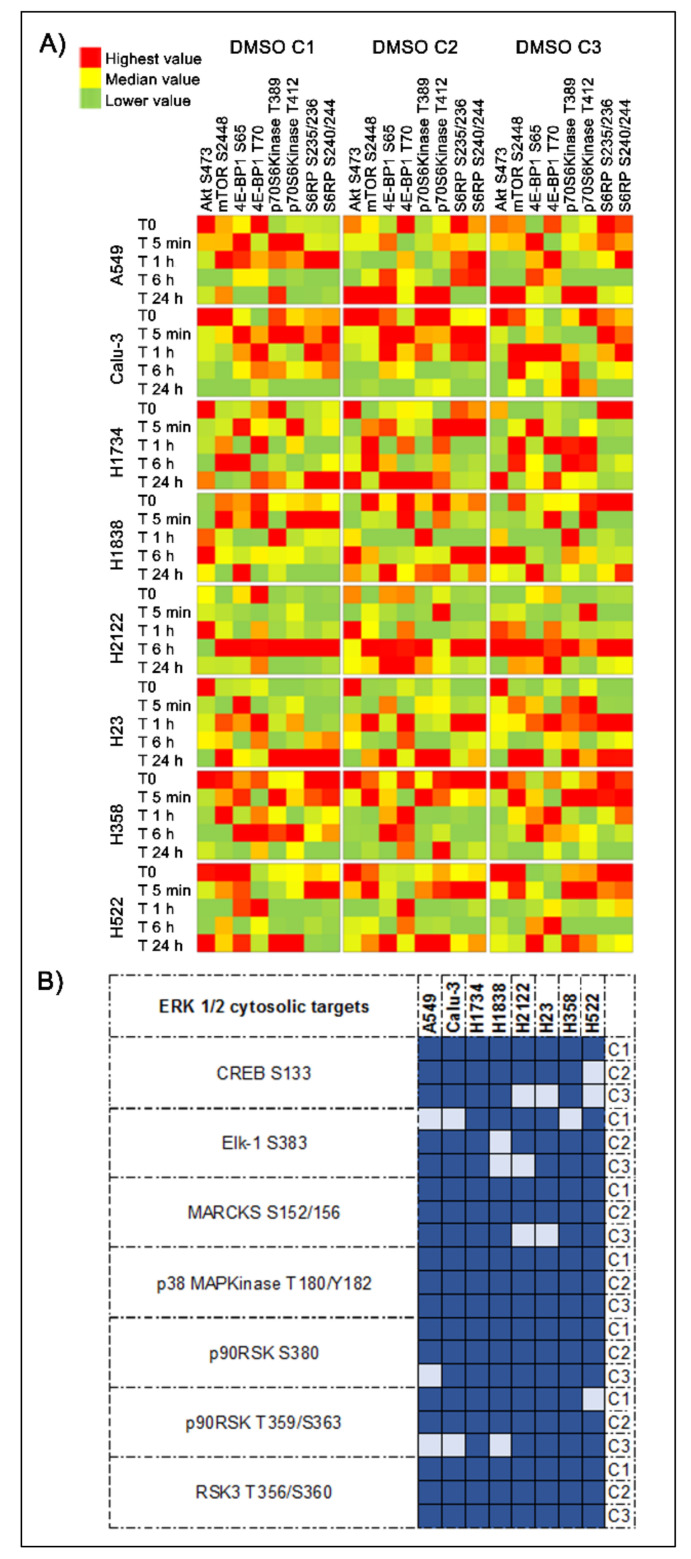
Figure 7.
Changes in AKT-mTOR signaling and in the activation of ERK 1/2 downstream substrates induced by the DMSO. Heatmaps display average values (n = 3) for proteins belonging to the AKT-mTOR signaling pathway across timepoints are shown using a red (highest) to green (lowest) scale (Panel A). Matrixes illustrate the number of cell lines in which significant differences were detected (dark blue) in ERK 1/2 cytosolic targets and regulated transcription factors across the three DMSO concentrations. (Panel B).

