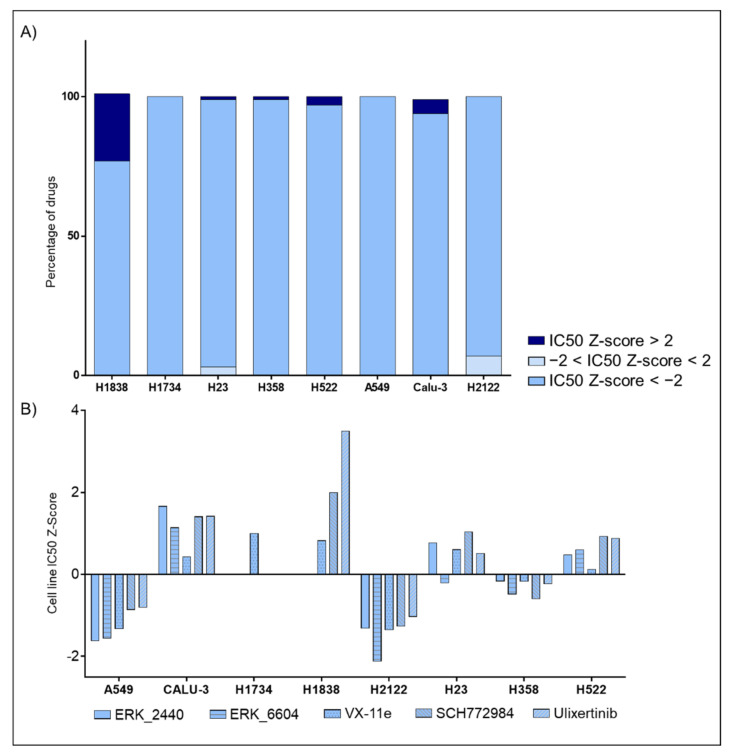
Figure 8.
Low-dose effects of DMSO on response to targeted compounds and chemotherapeutic agents. Bar graphs capturing drug susceptibility across eight NSCLC cell lines using the IC50 Z-scores provided by the GDSC project (Panel A). GDSC-derived data capturing responses to ERK inhibitors across lines (Panel B).

