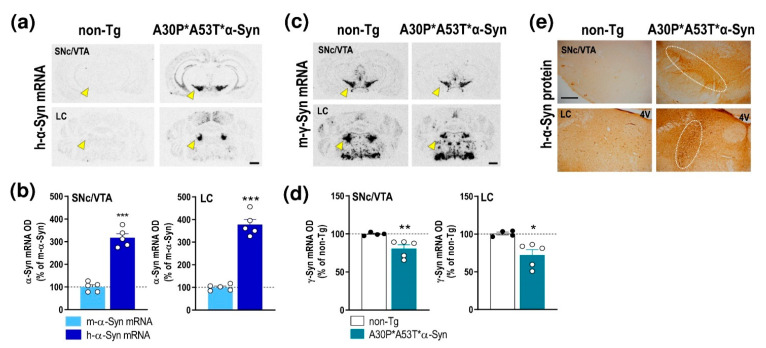
Figure 1.
Profile of α-Syn expression in monoamine brain areas of A30P*A53T*α-Syn transgenic mice. (a) Coronal brain sections showing h-α-Syn mRNA levels in SNc/VTA assessed by in situ hybridization. Yellow arrowheads indicate the brain regions quantified in b. Scale bar: 1 mm. (b) Increased h-α-Syn mRNA expression in SNc/VTA and LC of A30P*A53T*α-Syn transgenic mice compared with m-α-Syn mRNA expression levels in the same mice (n = 5 mice/group; *** p < 0.001 vs. m-α-Syn mRNA levels; Student’s t-test). (c) Coronal brain sections showing m-γ-Syn mRNA levels in SNc/VTA and LC assessed by in situ hybridization. Yellow arrowheads show the lower density of m-γ-Syn expression in A30P*A53T*α-Syn mice compared with non-Tg mice. Scale bar: 1 mm. (d) Reduced m-γ-Syn mRNA expression in SNc/VTA and LC of A30P*A53T*α-Syn transgenic mice compared with non-Tg mice (n = 4–5 mice/group; * p < 0.05, ** p < 0.01 versus non-Tg mice; Student’s t-test). (e) Representative photomicrographs showing accumulated levels of h-α-Syn protein in SNc/VTA and LC of A30P*A53T*α-Syn transgenic mice. White frames indicate the SNc/VTA and LC brain regions. Scale bar: 200 µm. For all figures, data represent the mean ± SEM. Abbreviations: SNc, substantia nigra compacta; VTA, ventral tegmental area; LC, locus coeruleus; 4V, 4-ventricle. See also Supplemental Figure S1.

