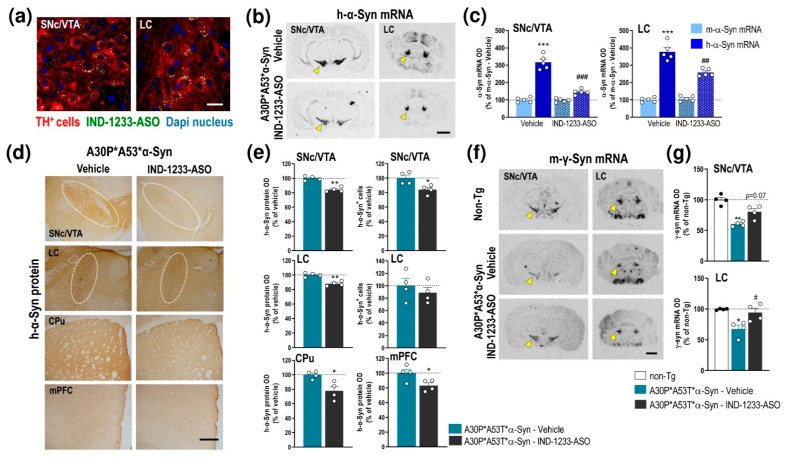
Figure 5.
Intracerebroventricular IND-1233-ASO treatment selectively inhibits the expression and accumulation of h-α-Syn in interconnected DA and NE brain regions of A30P*A53T*α-Syn transgenic mice. (a) Confocal images showing the co-localization of A488-IND-1233-ASO (green) with TH+ neurons (red) in the SNc/VTA and LC. Cell nuclei were stained with DAPI (blue). Scale bar: 10 µm. (b) Coronal brain sections showing reduced h-α-Syn mRNA expression in the SNc/VTA and LC of A30P*A53T*α-Syn mice treated with IND-1233-ASO (100 µg/day for 28 days), as assessed by in situ hybridization. Yellow arrowheads show h-α-Syn mRNA expression in SNc/VTA and LC. Scale bar: 1 mm. (c) Bar graphs showing significant reductions in h-α-Syn mRNA levels, but not m-α-Syn mRNA, in SNc/VTA and LC of IND-1233-ASO-treated A30P*A53T*α-Syn mice (n = 5 mice/group; *** p < 0.001 vs. m-α-Syn mRNA levels; ## p < 0.01, ### p < 0.001 vs. vehicle-treated A30P*A53T*α-Syn mice; two-way ANOVA and Tukey’s multiple comparisons test). (d) Representative photomicrographs showing a lower h-α-Syn protein density in the SNc/VTA, LC, CPu and mPFC of IND-1233-ASO-treated A30P*A53T*α-Syn mice vs. vehicle-treated A30P*A53T*α-Syn mice. White frames indicate SNc/VTA and LC brain regions. Scale bar: 200 µm. (e) Bar graphs showing significant reductions in h-α-Syn protein levels in the brain areas analyzed, as well as a decreased number of h-α-Syn+ cells in the SNc/VTA of IND-1233-ASO-treated A30P*A53T*α-Syn mice (n = 4 mice/group; * p < 0.05, ** p < 0.01 versus vehicle-treated A30P*A53T*α-Syn mice; Student’s t-test). (f) Representative images showing increased m-γ-Syn mRNA expression in SNc/VTA and LC of A30P*A53T*α-Syn mice treated with IND-1233-ASO as assessed by in situ hybridization. Yellow arrowheads show m-γ-Syn mRNA expression in SNc/VTA and LC. Scale bar: 1 mm. (g) Bar graphs showing significant increases in m-γ-Syn expression in the LC and a marginal effect in the SNc/VTA of IND-1233-ASO-treated A30P*A53T*α-Syn mice (n = 4 mice/group; * p < 0.05, ** p < 0.01 vs. non-Tg mice; # p < 0.05 vs. vehicle-treated A30P*A53T*α-Syn mice; one-way ANOVA). For all figures, data are the mean ± SEM. Abbreviations: mPFC, medial prefrontal cortex; CPu, caudate putamen; SNc, substantia nigra compacta; VTA, ventral tegmental area; LC, locus coeruleus. See also Supplemental Figure S3.

