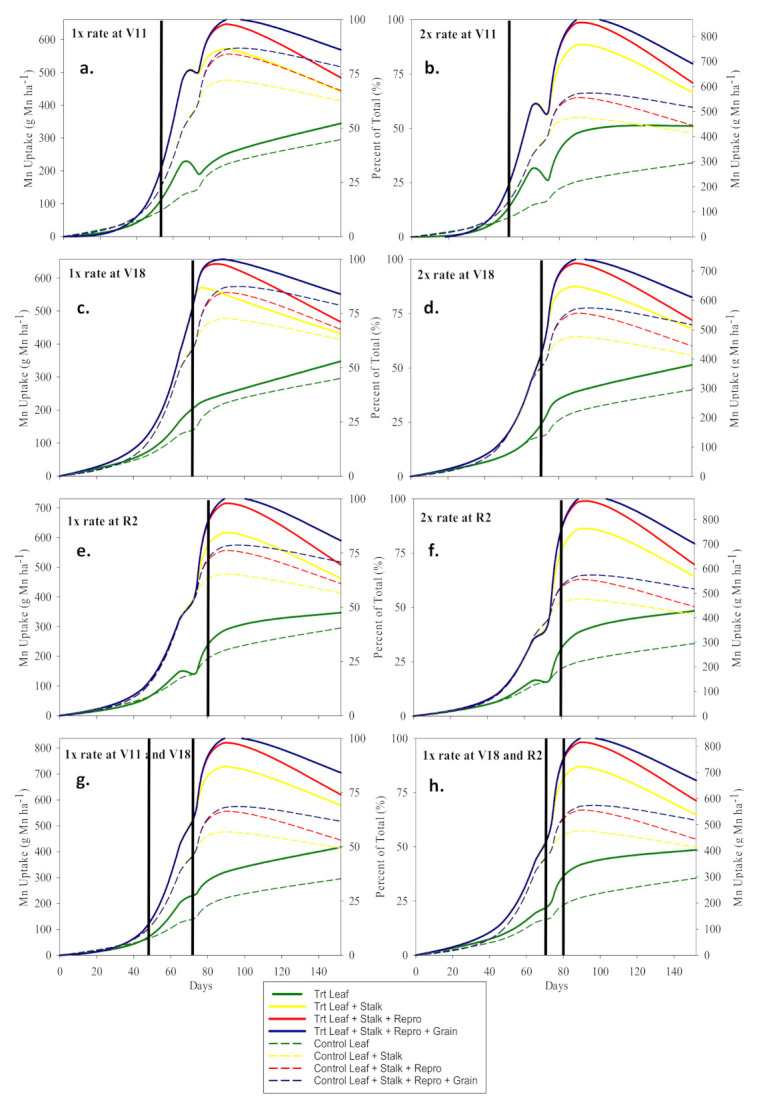
Figure 4.

Mn uptake (g Mn ha−1) and partitioning graphs. Solid and dashed lines represent foliar Mn treated plots and control plot, respectively. Solid vertical lines represent the time of application expressed as days after sowing. (a–h) corresponds with the treatments.
