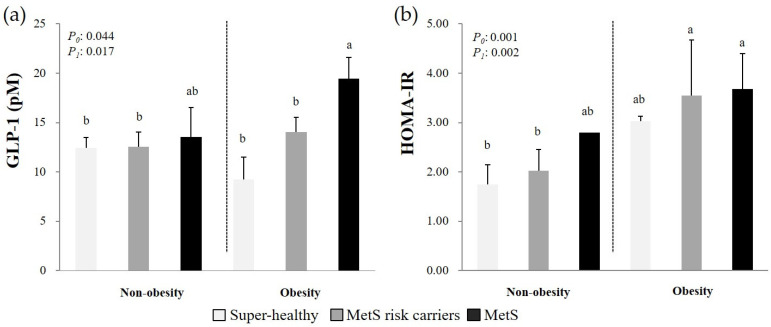
Figure 3.
Circulating GLP-1 levels (a) and HOMA-IR scores (b) according to the combination of obesity and MetS status. Mean ± SD, tested after log transformation of the data; tested by the one-way analysis of variance with the Bonferroni method and with the general linear model with LSD after adjustment for confounding factors (age, total calorie intake, cigarette smoking, alcohol drinking, and menopausal status); P0: Unadjusted p-value, P1: P-value adjusted for confounding factors. Values sharing the same alphabet indicate no statistically significant differences among them. GLP-1: Glucagon-like peptide-1; HOMA-IR: Homeostatic model assessment of insulin resistance; MetS: Metabolic syndrome. Non-obesity group: Super-healthy, n = 57; MetS risk carriers, n = 31; and MetS, n = 2. Obesity group: Super-healthy, n = 4; MetS risk carriers, n = 29; and MetS, n = 17.

