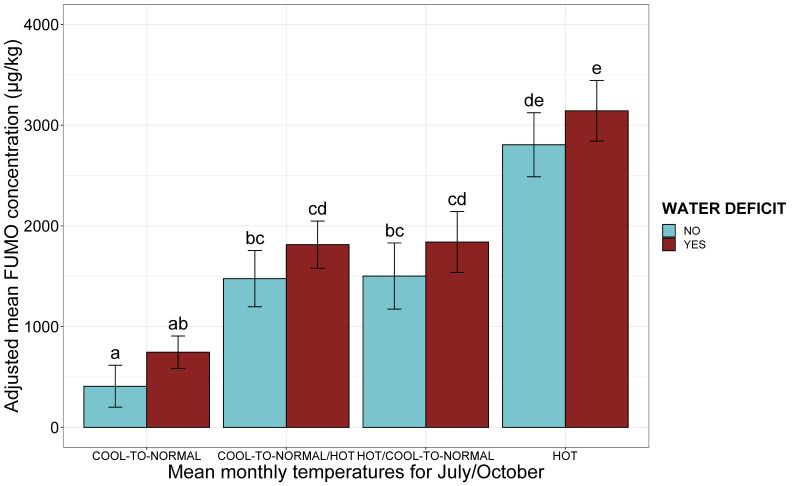
Figure 6.
Adjusted mean FUMO concentration according to mean monthly temperatures at flowering and maturity and the presence or absence of a water deficit. A composite variable for the temperatures in July and October (July/October when different) is shown on the x-axis. The adjusted mean FUMO concentrations obtained by applying the mixed linear model (lmer(FUMO ~ July_October monthly temperature*WATER DEFICIT + (1|Year)) to a database of 738 observations are shown on the y-axis. Blue bars correspond to observations for the absence of a water deficit, whereas red bars correspond to data for the presence of a water deficit. Different letters above bars indicate significant differences at p-value < 0.05 in Tukey’s multiple comparison test.

