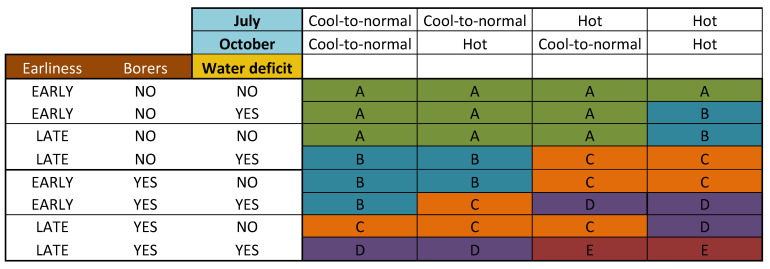
Figure 7.
Grid based on the multiyear data showing the impact of combinations of risk factors on FUMO content in maize. Agronomic factors (earliness and borers) and water deficit are represented on the left of the grid. Climatic factors (mean monthly temperatures in July and October) are represented at the top of the grid. The various intersections were grouped into a common factor ITK. Their adjusted means were obtained by applying the mixed linear model (lmer(FUMO ~ ITK + (1|Year)) to a database of 738 observations. These means were compared, grouped if not statistically different and then assigned to FUMO risk class (A to E), which are shown in different colors. In ascending order, A corresponds to a very low risk (green), B to a low risk (blue), C to a moderate risk (orange), D to a high risk (purple) and E to a critical risk (red).

