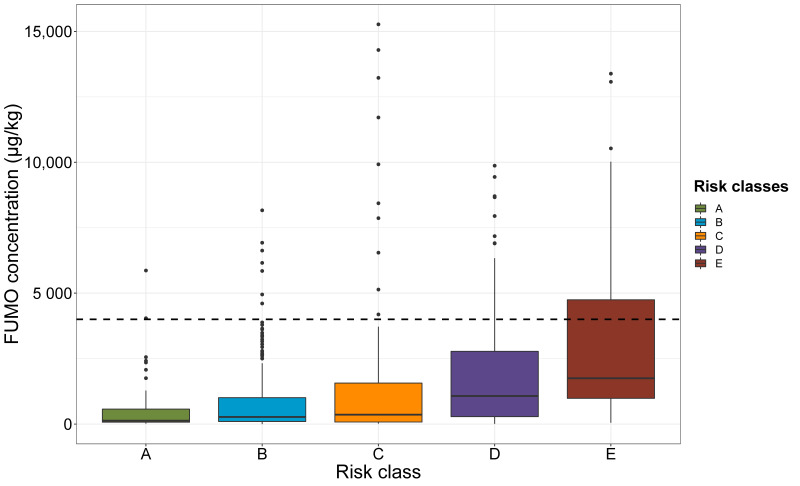
Figure 8.
FUMO concentration according to risk class. The risk classes for FUMO contamination are shown along the x-axis, in ascending order of risk, from left to right (A to E). The FUMO concentration of the 738 plots measured are shown on the y-axis. Colors distinguish the different risk classes: green for A, blue for B, orange for C, purple for D and red for E. Dashed line represents the EU maximum limit for FUMO in food for human consumption (4000 µg/kg).

