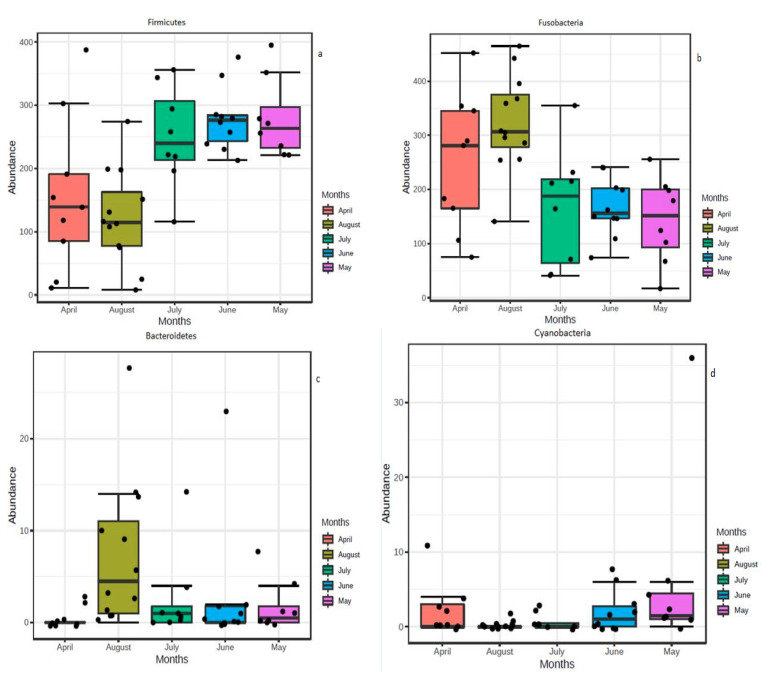
Figure 3.
Comparative abundances of all the Lake Tana samples identified by univariate nonparametric analysis (Mann–Whitney test) based on a single grouping variable at phylum level. The black points represent individual samples. Features are considered to be significant based on their adjusted p-value = 0.05. All phyla showed significant p-value. (a) Phylum Firmicutes, (b) Phylum Fusobacteria, (c) Phylum Bacteroidetes and (d) Phylum Cyanobacteria.

