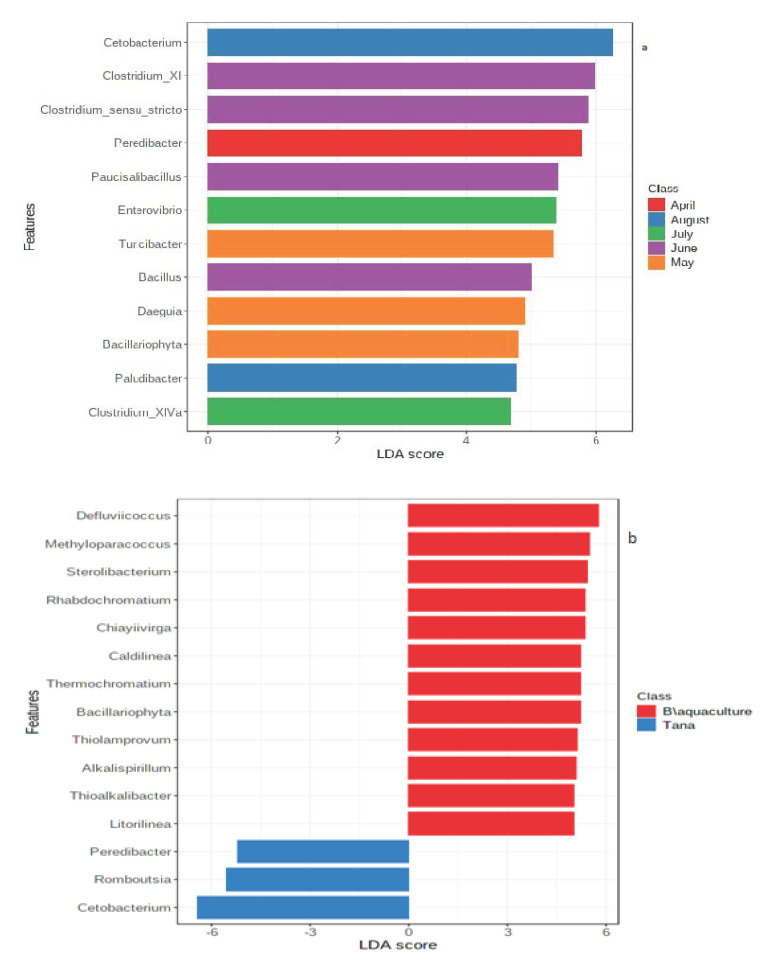
Figure 4.
Graphical summary of important taxa identified by linear discriminant effect size (LEfSe) analysis at the genus level. (a) Lake Tana samples based on sampling months and (b) comparison of Lake Tana and Bahir Dar aquaculture facility centre samples. Horizontal bars represent the effect size for each taxon. Features are considered to be significant based on their adjusted p-value = 0.05.

