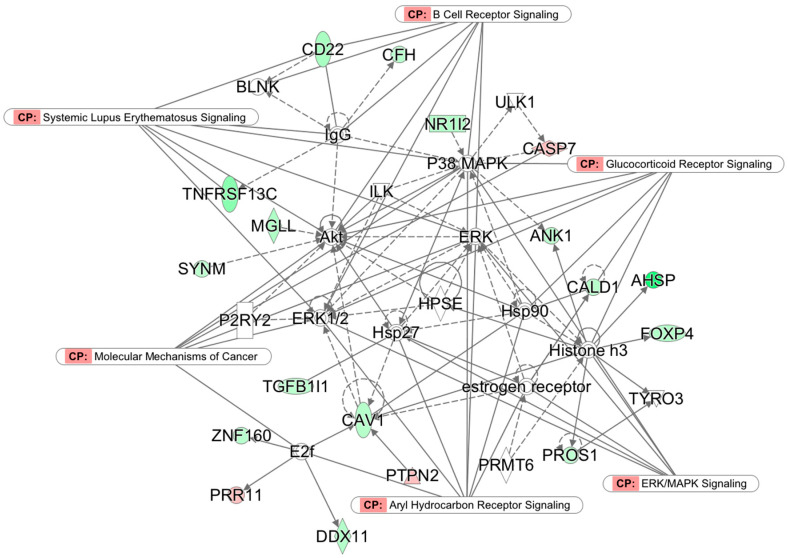
Figure 3.
Network 2 (p-score 28): Cellular morphology, cell-to-cell signaling and interaction, and hematopoiesis. Nodes without color denote non-significant genes, solid lines denote direct connections, and dotted lines denote indirect connections. Genes color-coded in red are upregulated and those in green are downregulated in the TM group. CP indicates canonical pathways.

