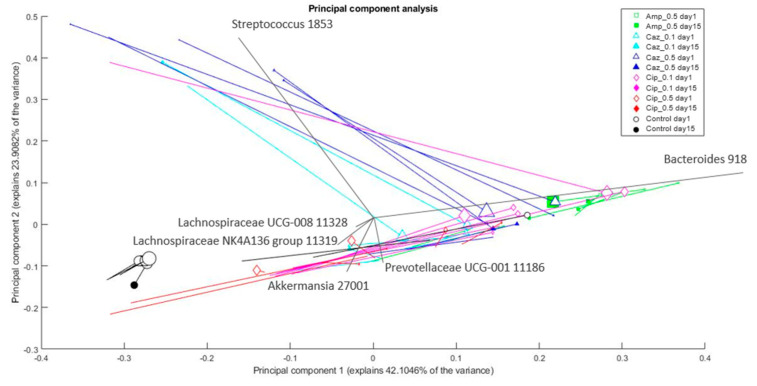
Figure 6.
Changes in the composition of bacterial genera in the microbiota after different treatments. The % of variance explained by the component is shown on the axes; each marker represents one sample; colors correspond to the treatment (drug + dose) (Amp_0.5: green; Caz_0.1: cyan; Caz_0.5: blue; Cip_0.1: magenta; Cip_0.5: red; control: black); marker shapes correspond to the treatment (drug) administered. Legend: square: Amp; triangle: Caz; rhombus: Cip; circle: control; marker area refers to the sampling date (empty marker: day 1; full marker: day 15); lines connect the samples from the same source; therefore, changes in a sample (in the principal component analysis (PCA) space) can be seen from the empty marker to the full one following the line between them. Marker size correlates with Klebsiella content (relative abundance) of the sample. Arrows show the direction and importance of the original dimensions (the taxonomic categories) in the PCA space. PCA plot with uniform marker size (without Klebsiella) may be found in Supplementary Figure S4 in the Supplementary Material S1.

