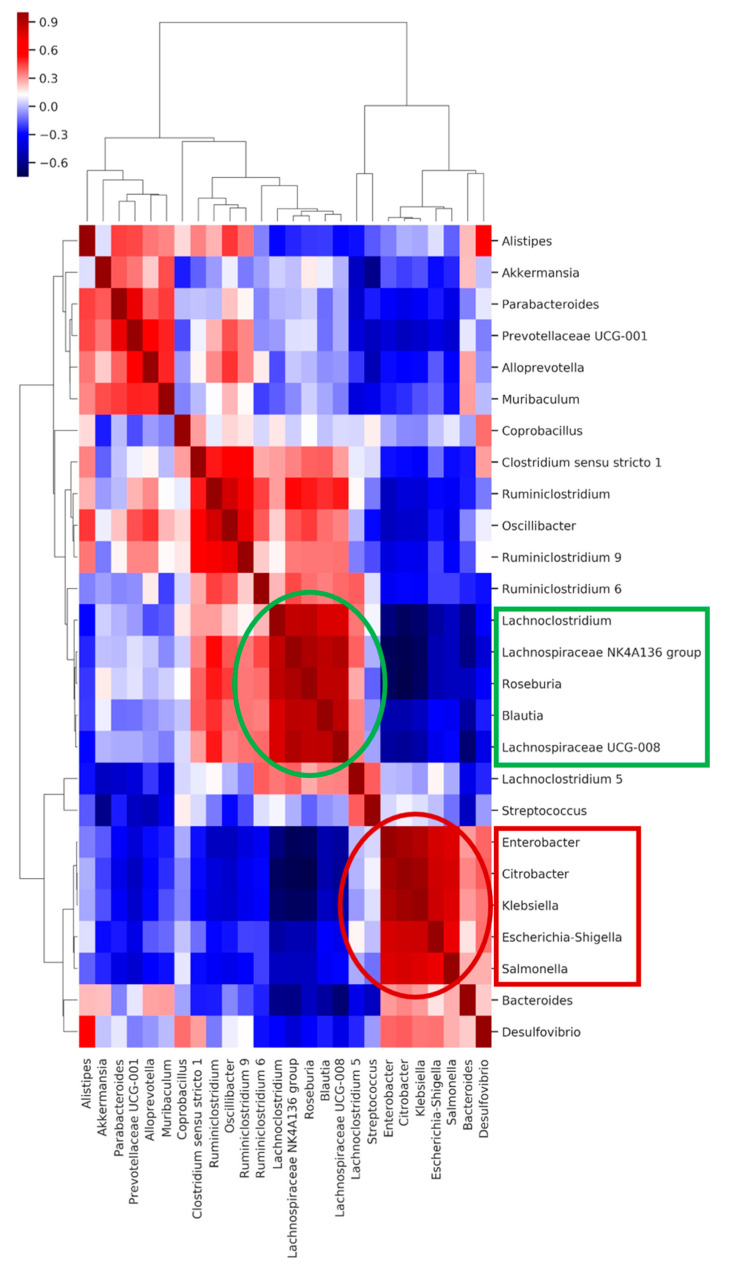
Figure 8.
The heatmap shows the pairwise correlation (Spearman’s rho) between selected bacterial abundances in day-15 samples. The bacterial groups at the x- and y-axes were clustered based on Bray–Curtis distances. Colors are corresponding to the rho values: deeper blue colors represent stronger negative, deeper red colors stronger positive correlations.

