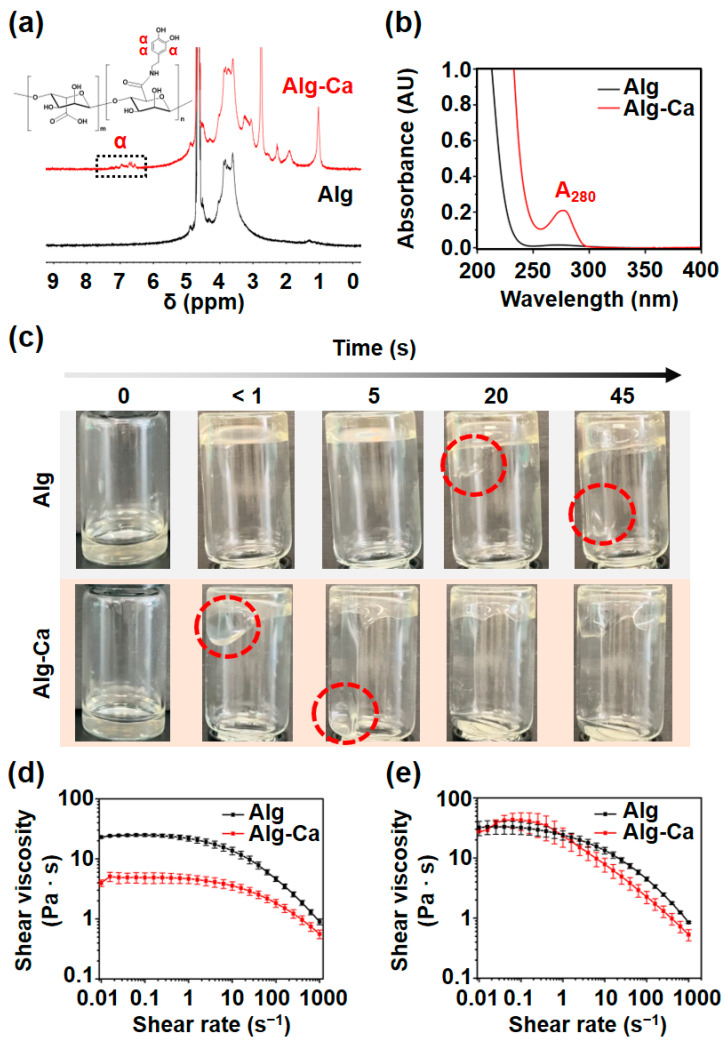
Figure 2.
Physicochemical characteristics of Alg-Ca compared to Alg. (a) 1H NMR spectrum of Alg (black) and Alg-Ca (red). Alg-Ca 1H NMR spectrum exhibited proton peaks that indicate the appearance of the catechol α proton. (b) UV–vis spectrum of Alg (black) and Alg-Ca (red) aqueous solution. (c) Viscosity comparison of Alg (top) and Alg-Ca (bottom) solution (3 w/v % in DW) in 10 mL vial. Red dashed lines indicate the solution flowing down. Shear viscosity of Alg (black) and Alg-Ca (red) in DW (d), and in HEPES buffer (25 mM, pH 7.4) (e) depending on shear rate (0.01–1000 s−1) (n = 3, mean ± SD).

