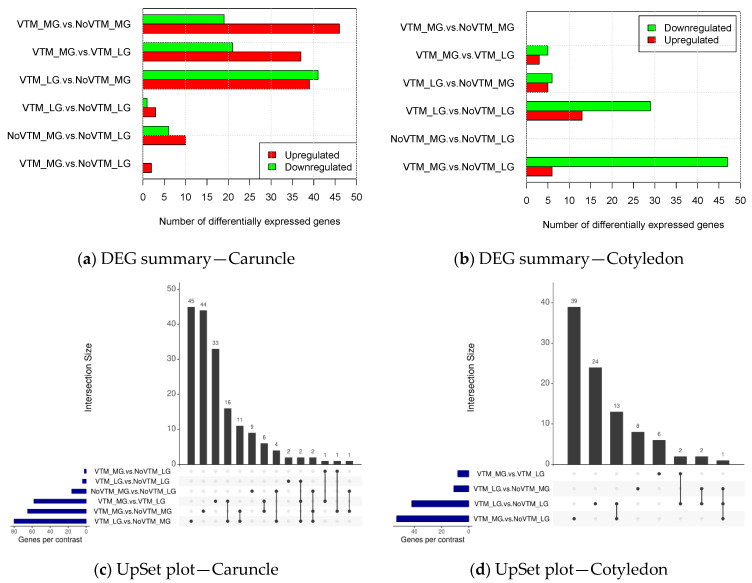
Figure 2.
Differential gene expression summary of bovine placental tissues—caruncle (maternal placenta) (a) and cotyledon (fetal placenta) (b) (padj ≤ 0.1). The UpSet plot represents the intersection between the sets of differentially expressed genes (DEGs) from different contrasts of caruncle (c) and cotyledon (d). Each vertical bar shows the number of genes in the intersection. The dot plot reports the set participation in the intersection, and the horizontal bar graph reports the set sizes (total of DEGs). The treatments were arranged as follows: NoVTM_LG—no vitamin and mineral supplementation and low gain; VTM_LG—vitamin and mineral supplementation and low gain; NoVTM_MG—no vitamin and mineral supplementation and moderate gain; and VTM_MG—vitamin and mineral supplementation and moderate gain.

