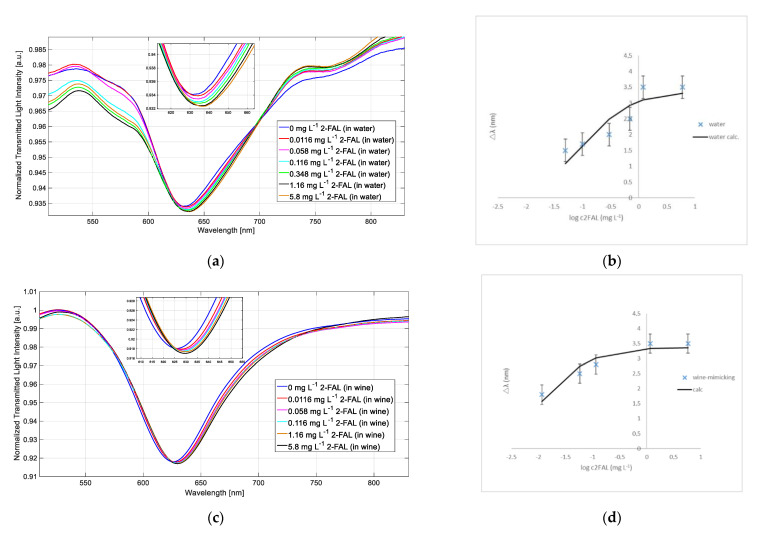
Figure 6.
(a) SPR spectra of the SPR-MIP sensor at different 2-furaldheide (2-FAL) concentrations in water; (b) SPR wavelength shift vs. concentration of 2-FAL in a water solution and the calculated continuous curve; (c) SPR spectra of the SPR-MIP sensor at different 2-FAL concentrations in wine-mimicking solution; (d) SPR wavelength shift vs. concentration of 2-FAL in wine-mimicking solution and the calculated continuous curve. Vertical bars in (b,d) correspond to the standard deviations (error bars).

