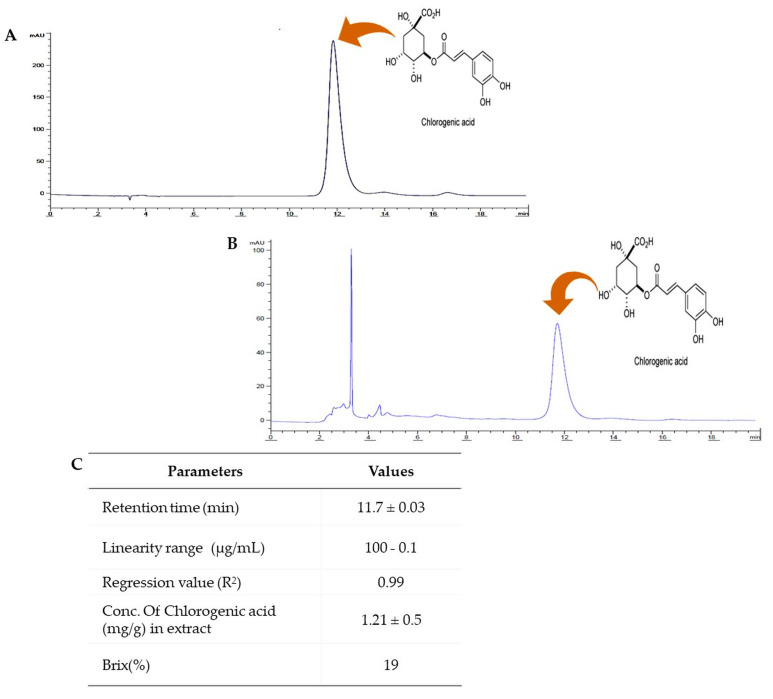
Figure 3.
HPLC analysis of Pyrus ussuriensis Maxim ethanol (50%) extract. (A) The chromatogram obtained by HPLC analysis of the chlorogenic acid standard solution and (B) PUE. (C) The table shows the different parameters obtained during the method validation procedure and chlorogenic acid content determination using ACN and 0.5% aqueous phosphoric acid (11.5:88.5 ratio, V/V) as the mobile phase, an injection volume of 20 µL, a 40 °C column temperature, and a wavelength of 327 nm.

