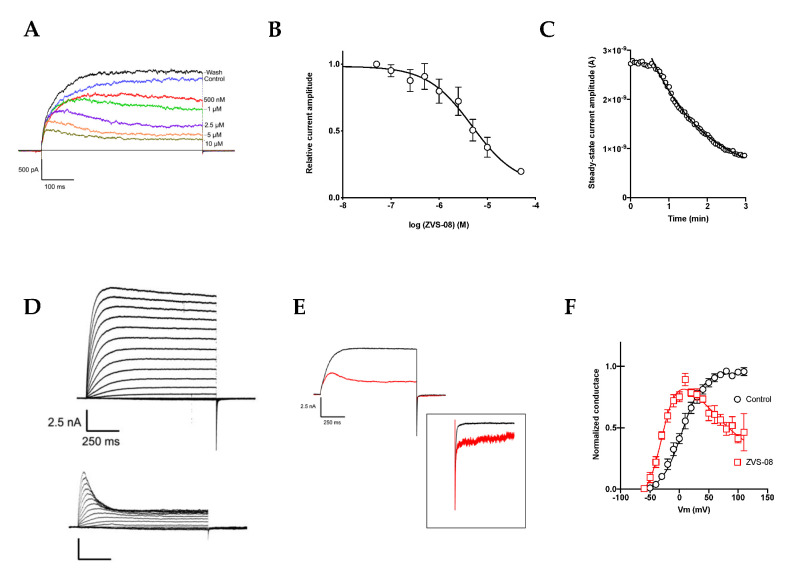
Figure 9.
(A) Inhibition by different concentrations of ZVS-08 hit compound. (B) Dose–response (data from 3–10 independent determinations, mean ± SEM). (C,D) Current–voltage relationship in the absence (upper traces) or presence of 5 µM ZVS-08 (lower traces) obtained by depolarisation from a holding potential of −80 mV to potentials ranging between −60 and +100 mV. (E) The traces corresponding to depolarisation to +40 mV are superimposed for easier comparison. The inset shows the normalised tail currents to highlight the slower deactivation in the presence of ZVS-08. (F) Conductance–voltage relationship in control (black symbols) and in the presence (red symbols) of 5 µM ZVS-08, obtained by biexponential fit to the tail current (at −80 mV) and extrapolation to time 0. The solid lines represent the result of a fit using a Boltzmann distribution with a block at positive voltages.

