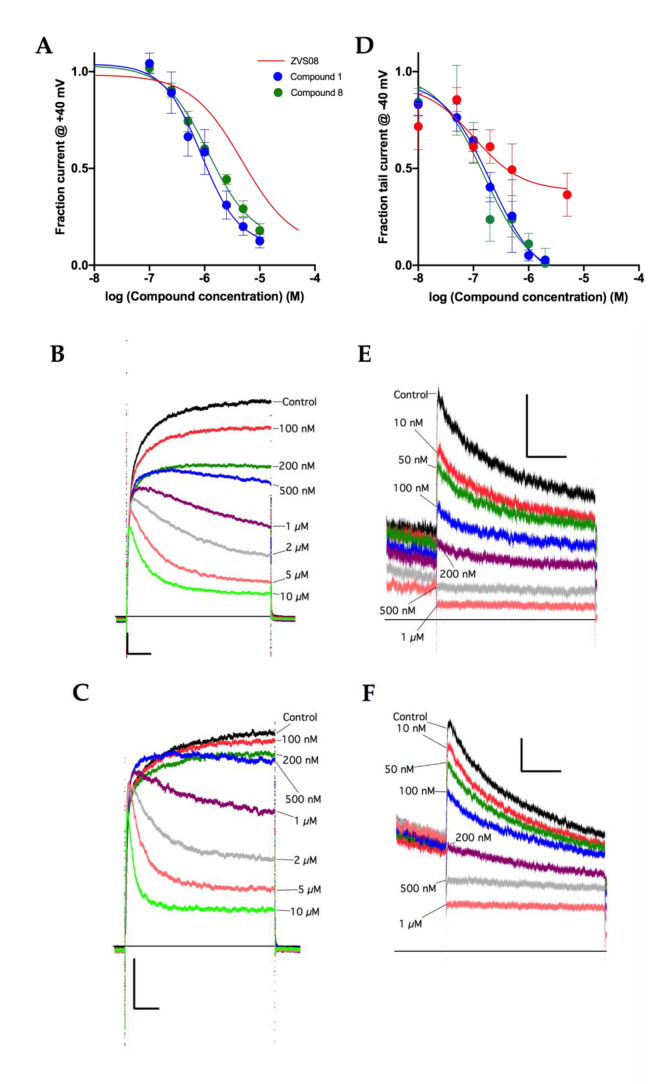
Figure 12.
(A) Dose–response curves of compounds 1 and 8 for KV1.10 inhibition. The red trace has been included as reference and corresponds to ZVS-08 (from Figure 9B). The IC50 values from the fit were 740 nM (95% CI 490 nM to 1.17 µM, N = 7–9) for compound 1 and 1.01 µM (95% CI: 796 nM to 1.30 µM, N = 4–7) for compound 8. (B) Representative Kv10.1 current traces obtained in the presence of different concentrations of Compound 1. Scale bars: 1 nA, 50 ms. The cell was depolarized to +40 mV for 500 ms. No leak subtraction was performed. (C) Representative traces obtained in the presence of different concentrations of Compound 8. Scale bars: 1 nA, 50 ms. (D) Dose–response curves of compounds ZVS-08, 1 and 8 for hERG inhibition. The IC50 values from the fit were 0.194 µM (95% CI 0.047 µM to 0.761 µM, N = 2–7) for ZVS-08, 0.207 µM (95% CI 0.113 µM to 0.395 µM, N = 3–8) for compound 1 and 0.156 µM (95% CI: 0.070 µM to 0.373 µM, N = 3–8) for compound 8. (E) Representative traces of hERG currents obtained in the presence of different concentrations of Compound 1. Scale bars: 150 pA, 1 s. Only the end of the response at +20 mV and the tail current at −40 mV are represented. (F) Representative traces obtained in the presence of different concentrations of Compound 8. Scale bars: 150 pA, 1 s.

