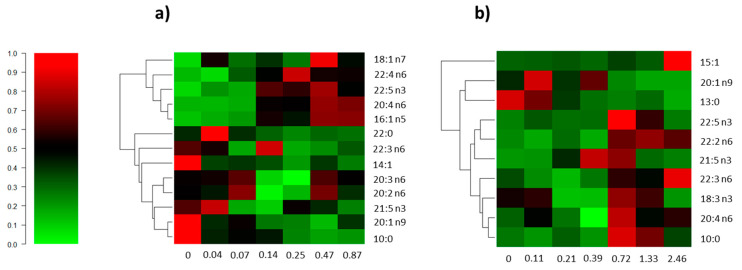
Figure 3.
Heatmap depicts an overall comparison of the significantly different fatty acids in Gibbula umbilicalis (a) and Palaemon elegans (b) based on their sensitivity to different concentrations of Asparagopsis armata exudate. Rows are clustered using Bray–Curtis distances and unweighted pair group method with arithmetic mean (UPGMA) clustering method, and color scaling (relative units) was performed by row after normalization of each fatty acid to the mean of the respective control. On the XX axis are the concentrations of A. armata exudate in percentage (%).

