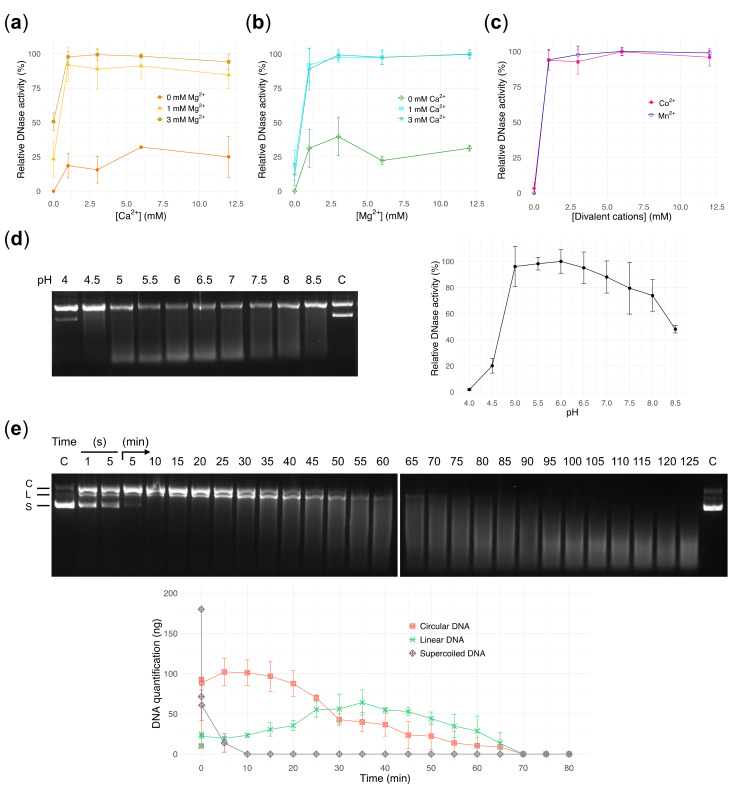
Figure 2.
Characterization of DNase1L2 activity using purified plasmid DNA. (a–c) Gel densitometric analysis showing the effects of divalent cations on DNase1L2 activity. Data are means ± SD of three independent experiments. (a) Calcium titration in the presence of 0, 1, and 3 mM MgCl2. (b) Magnesium titration in the presence of 0, 1, and 3 mM CaCl2. (c) Manganese titration and cobalt titration. (d) Agarose gel electrophoresis (left panel) and densitometric analysis (right panel) showing the effect of pH on DNase1L2 activity. C: control, plasmid DNA without enzyme at pH 4. Data are means ± SD of three independent experiments. (e) Agarose gel electrophoresis (upper panel) and densitometric analysis (bottom panel) showing the time course of DNase1L2 activity. Plasmid DNA (200 ng; 90% supercoiled) was incubated with DNase1L2 (69 pmol) in the time range from 1 s to 125 min. C: control, supercoiled plasmid DNA without enzyme. Plasmid DNA forms are indicated at the left of the gel and correspond to the plots in the graph; C: circular DNA, L: linear DNA, S: supercoiled DNA. Data are means ± SD of two independent experiments.

