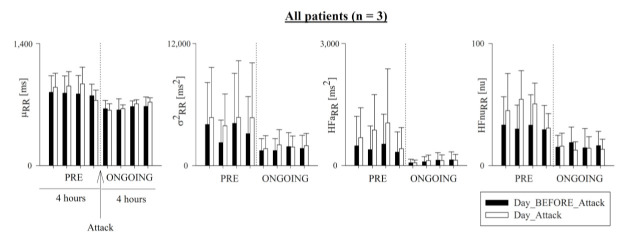
Figure 3.
Temporal evolution of time- and frequency-domain HRV markers in all patients. Bar graphs show RR mean (μRR), RR variance (σ2RR), and absolute (HFaRR) and normalized (HFnuRR) power in the HF band in all patients. Indices were calculated hour-by-hour in the 4 h preceding (PRE) and the first 4 h following the onset of the HAE attack (ONGOING) on the day of the attack (Day_Attack, white bars), and compared to data during the same circadian phase on the day before (Day_BEFORE_Attack, black bars). Results shown as mean ± standard deviation.

