
Figure 4.
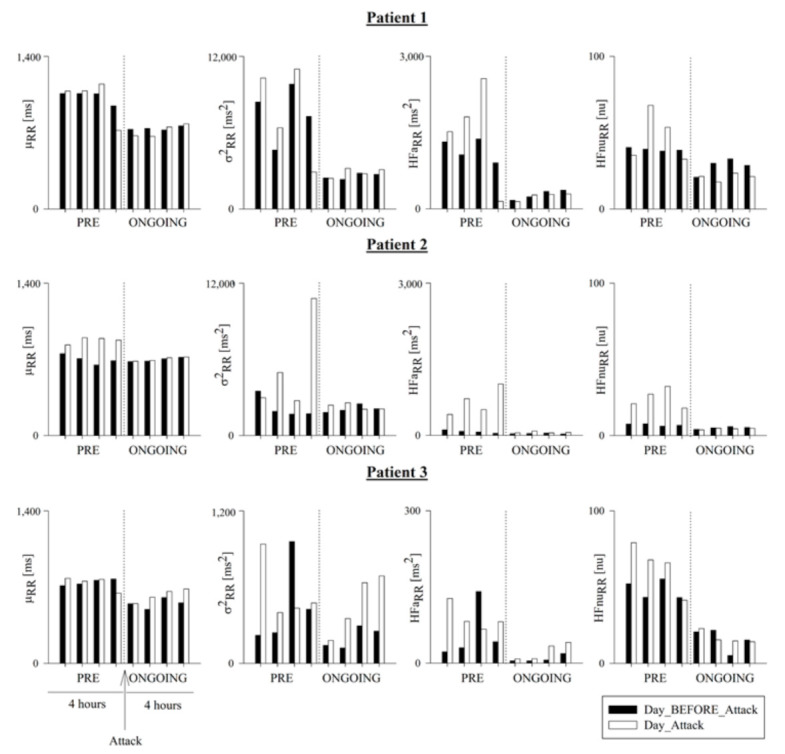
Temporal evolution of time and frequency domain HRV markers in Patients 1, 2 and 3. Bar graphs show the RR mean (μRR), RR variance (σ2RR), and the absolute (HFaRR) and normalized (HFnuRR) power in the HF band in Patient 1 (upper panels), Patient 2 (middle panels), and Patient 3 (lower panels). Indices were calculated hour-by-hour in the 4 h preceding (PRE) and the first 4 h following the onset of the HAE attack (ONGOING) on the day of the attack (Day_Attack, white bars) and compared to data during the same circadian phase on the day before (Day_BEFORE_Attack, black bars). Results are shown as mean ± standard deviation.