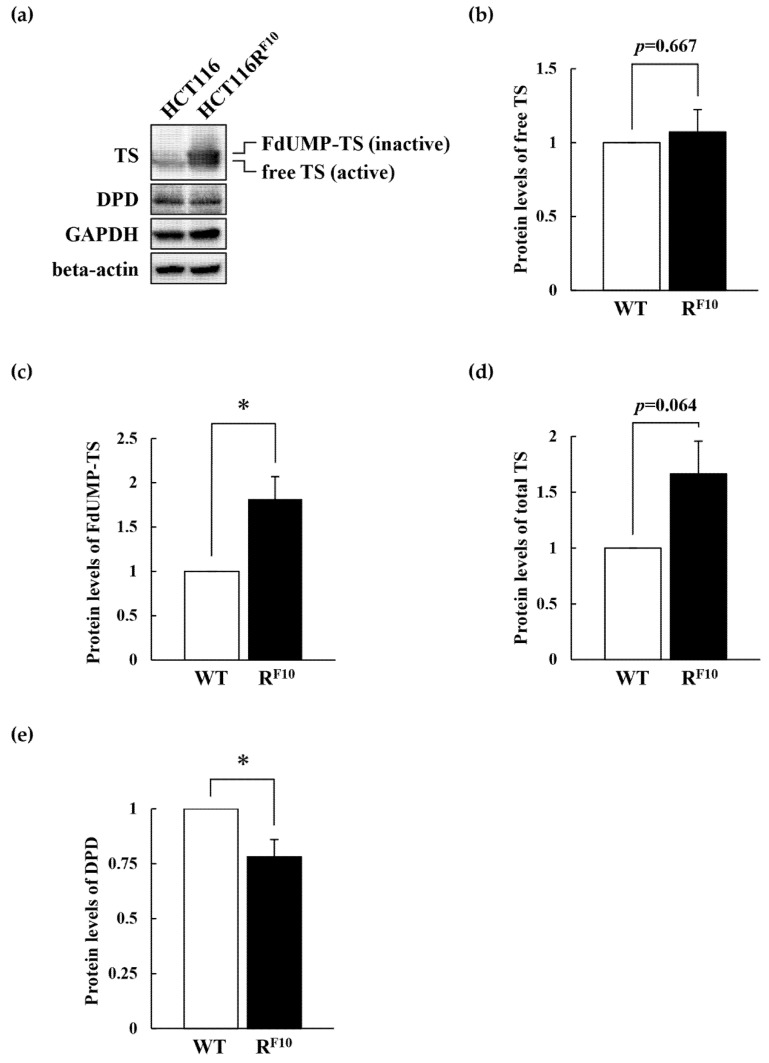
Figure 6.
Protein levels of TS and DPD in 5-FU-resistant HCT116RF10 and parental HCT116 cells. (a) Whole-cell lysates were prepared from parental HCT116 and HCT116RF10 cells. Protein levels of TS, DPD, GAPDH, and beta-actin were measured by Western blot analysis. The expression levels of GAPDH and beta-actin were used as an internal control. Data are representative of at least three independent experiments. Protein levels of (b) free TS, (c) FdUMP-TS, (d) total TS, and (e) DPD in parental HCT116 and HCT116RF10 cells. Levels of TS and DPD protein in HCT116RF10 cells are represented by the ratio of TS or DPD density to GAPDH density relative to the value for parental HCT116 cells. Results represent the averages of three independent experiments with error bars showing ±SE of triplicates. * p < 0.05.

