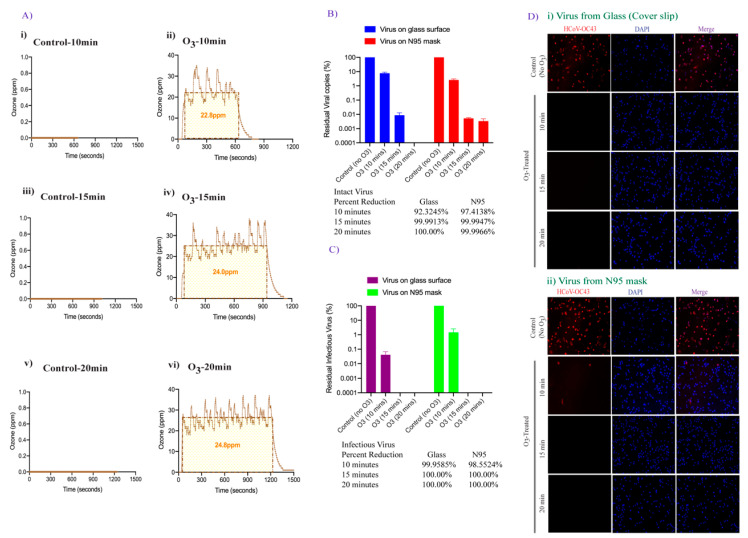
Figure 4.
FATHHOME’s ozone dose-response assessment of HCoV-OC43 inactivation. (A). The ozone (ppm) vs. time (sec) plot showing the average ozone gas to which the virus was exposed during ~25 ppm-10, 15, and 20 min ozone treatment, as generated via FATHHOME device. (B). HCoV-OC43 virus aliquot (100 µL) was placed on glass coverslips and N95 FFRs and exposed to 25 ppm of ozone for 10, 15-, and 20-min. Following ozone treatment, HCoV-OC43 was collected for viral RNA extraction. Intact residual viral copies were calculated based on the standard curve. (C). HCoV-OC43 virus was collected post ozone treatment, for virus infectivity and replication, and subjected to the infection of A549-hACE-2 cells. Intracellular infectious RNA copies were determined through qRT-PCR and viral copies were calculated based on the standard curve and quantified with respect to untreated controls, set to 100%. (D). HCoV-OC43 infection and replication in untreated and ozone-treated HCoV-OC43 virus infected cells was detected by immune localization of HCoV-OC43 nucleocapsid protein through IFA (red signals). Nuclei were stained with TO PRO-3 (blue signals). The quantification of cells was done using automated Image J macro analysis.

