
Figure 2.
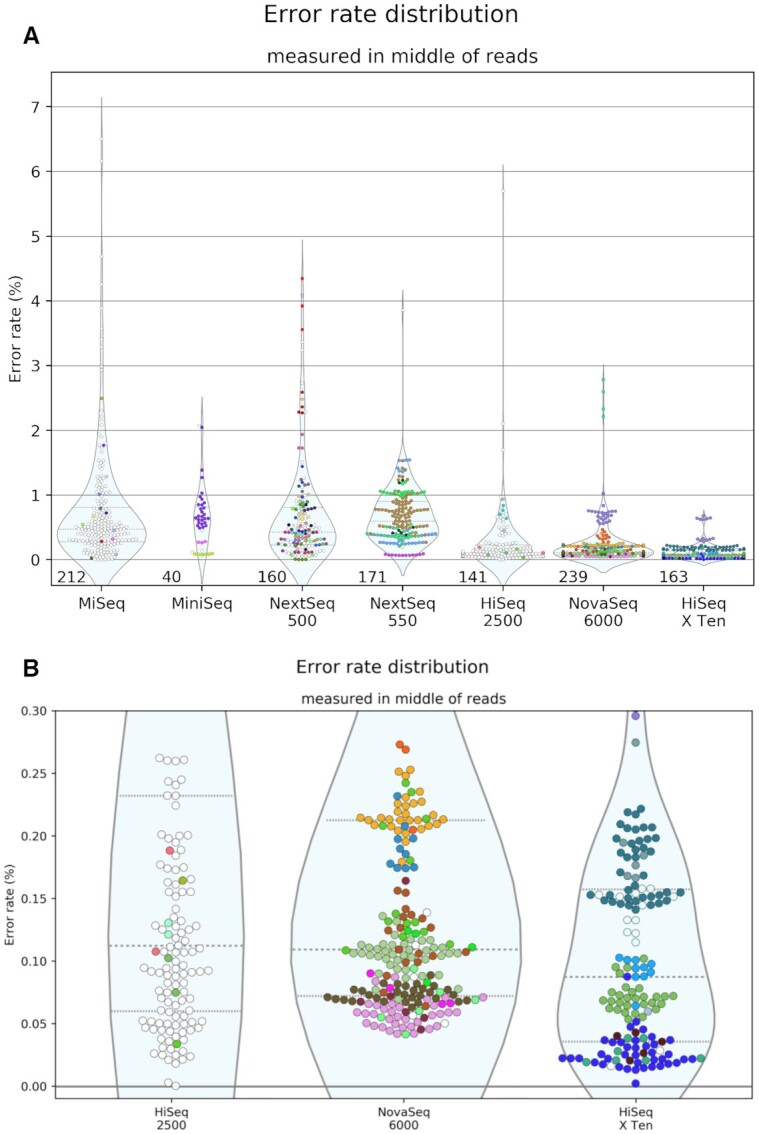
Error rates calculated from the overlap between read pairs. Errors were counted from the regions of reads 50–60% of the way through their lengths. Each SRA run is shown as one point. Only runs with sufficient overlap are shown; each must have a total of at least 2.5 Mb in the 50–60% bin. The number of runs shown is displayed at the bottom of each distribution. A different color was given to each group with more than three samples in the survey. Groups with three or fewer are colored white. Groups are defined by the combination of the center, lab and contact metadata fields. Panel (A) displays all instruments in the survey with more than 10 passing runs. Panel (B) is a zoom on the low-error instruments, showing only runs with an error rate <0.3%.