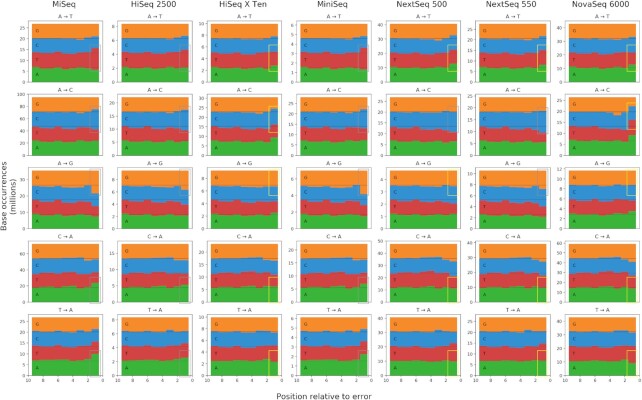
Figure 3.
The count of each base in the genomic context surrounding each type of substitution. The X-axis represents the distance from the error base. The rightmost slot is the closest (adjacent to the error base), and the leftmost is the furthest (nine bases from the error). The Y-axis is the count of how many of each base was observed at each distance from a substitution of that type. Boxes highlight the count of the error base adjacent to the error. Gray boxes surround counts which are over-represented, as expected. Yellow boxes surround counts which do not seem to follow this pattern.

