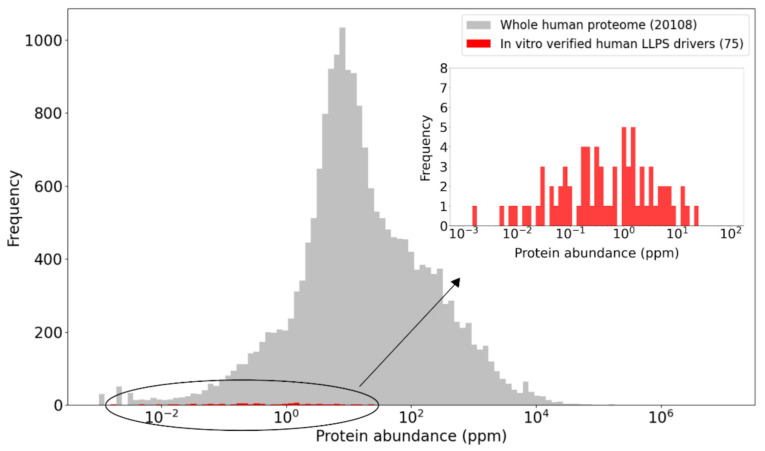
Figure 4.
Human LLPS driver proteins are of relatively low abundance compared to the proteome average. The highest tissue- or cell type-specific integrated abundance value was derived for each human protein from PaxDb. These maximal abundances of human LLPS driver proteins (red) are compared to those of the proteome (grey) using histograms. The abundances of LLPS drivers are also separately depicted in the inset histogram to ensure better resolution of the data. Abundances are provided in parts per million (ppm) units on the X-axis.

