
Figure 1.
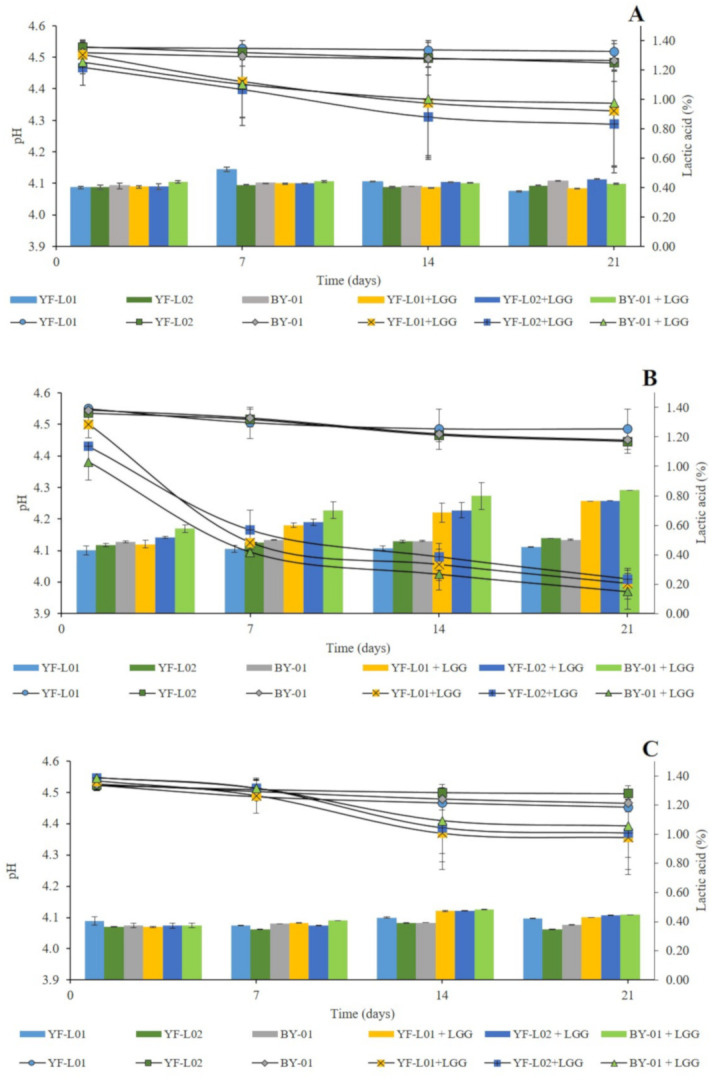
pH (left axis) and titratable acidity (TA) represented as lactic acid percentage (right axis) measurements of fermented (A) soy, (B) oat, and (C) coconut samples at day 1, 7, 14, 21.
Official websites use .gov
A
.gov website belongs to an official
government organization in the United States.
Secure .gov websites use HTTPS
A lock (
) or https:// means you've safely
connected to the .gov website. Share sensitive
information only on official, secure websites.
pH (left axis) and titratable acidity (TA) represented as lactic acid percentage (right axis) measurements of fermented (A) soy, (B) oat, and (C) coconut samples at day 1, 7, 14, 21.