Figure 3.
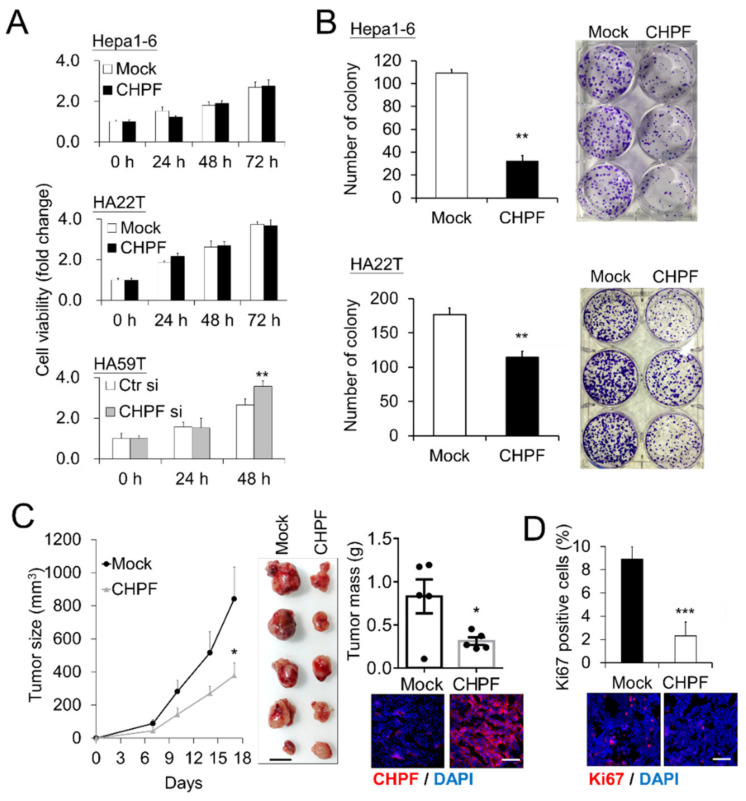
Effects of CHPF on HCC cell growth in vitro and in vivo. (A) CHPF modulated cell viability in vitro. Viability of Hepa1-6, HA22T, and HA59T cells was measured using CCK8 assays at indicted time points. Relative fold changes are shown. Data are presented as the means from three independent experiments ± standard deviations; ** p < 0.01. (B) CHPF overexpression suppressed colony formation in Hepa1-6 and HA22T cells. The data are presented as the means ± standard deviations; ** p < 0.01. Representative images are shown on the right. (C) Effects of CHPF on HCC tumor growth in mouse models. Hepa1-6 control transfectants and an equal number of CHPF transfectants were subcutaneously administered to the right flank (n = 5, each group). Size and mass of the excised tumors were recorded; shown are the means ± standard errors of the means; * p < 0.05. The scale bar indicates 10 mm. Immunostaining of CHPF in tumor sections (lower right; the scale bar indicates 100 μm). (D) CHPF suppressed cell proliferation in Hepa1-6 tumors. Proliferation of tumor cells was evaluated by immunofluorescence staining for Ki67, and representative images of tumor section are shown (bottom). The data are presented as the means from five fields of each section ± standard deviations; *** p < 0.001. The scale bar indicates 100 μm.

