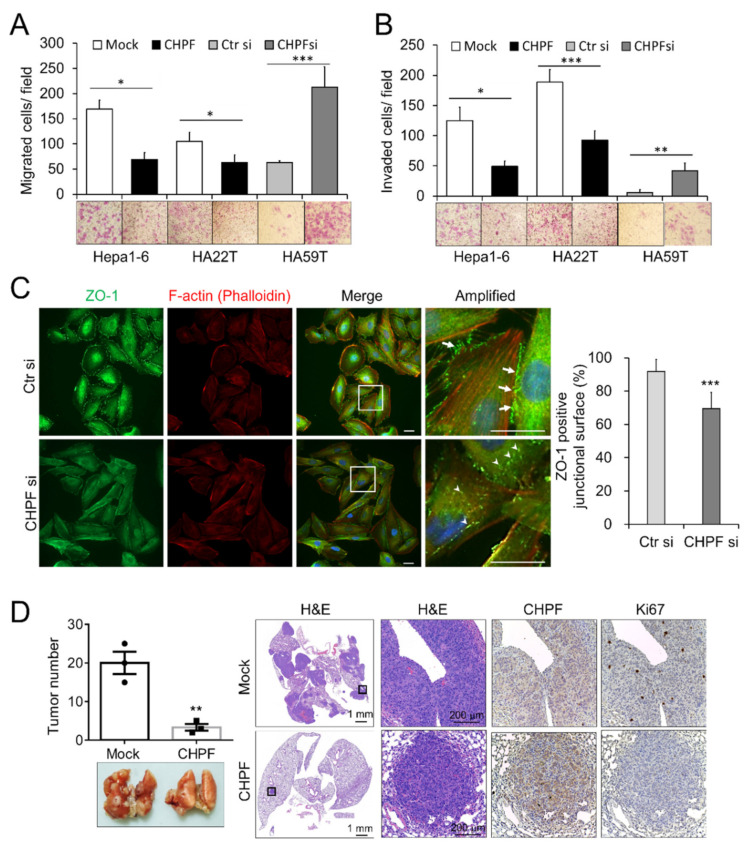
Figure 4.
Influence of CHPF on the migration, invasion, and metastasis of HCC cells. (A) CHPF regulated transwell cell migration and (B) Matrigel invasion. CHPF overexpression significantly suppressed the migration and invasion abilities of Hepa1-6 and HA22T cells, and CHPF knockdown increased the migration and invasion abilities of HA59T cells. The data presented as the means from three independent experiments ± standard deviations. Representative images are shown at the bottom; * p < 0.05; ** p < 0.01; *** p < 0.001. (C) Immunostaining of ZO-1 (green) and F-actin (red) in HA59T cells. Amplified images are shown on the right. Note that ZO-1 is expressed on the plasma membrane of two neighboring control cells (indicated by arrows); CHPF knockdown increased the intracellular distribution of ZO-1 (indicated by arrowheads). The scale bar indicates 20 μm. The percentage of plasma membrane-associated ZO-1 positive cells was shown at right. *** p < 0.001. (D) CHPF suppressed lung metastasis. The number of tumors was decreased in the CHPF-overexpressing group. Representative images are shown at the bottom. Representative images of the hematoxylin and eosin staining and immunohistochemical staining for CHPF and Ki67 in the lung sections are shown on the right; ** p < 0.01.

