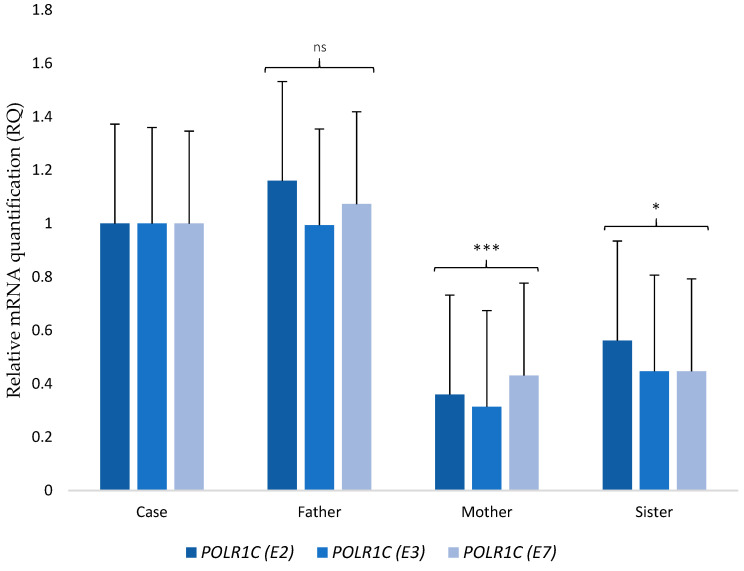
Figure 3.
RT–PCR analysis of mRNA expressions of POLR1C in the patient and her unaffected family members. mRNA expression determined by RT–PCR is calculated as a ratio relative to HPRT1 and expressed relative to her parents and sibling. (E2), (E3), and (E7) indicate the different primers used to analyze expression of POLR1C. Error bars represent standard deviation (SD). ***, p < 0.0001; *, p < 0.05; ns, not significant.

