Figure 5.
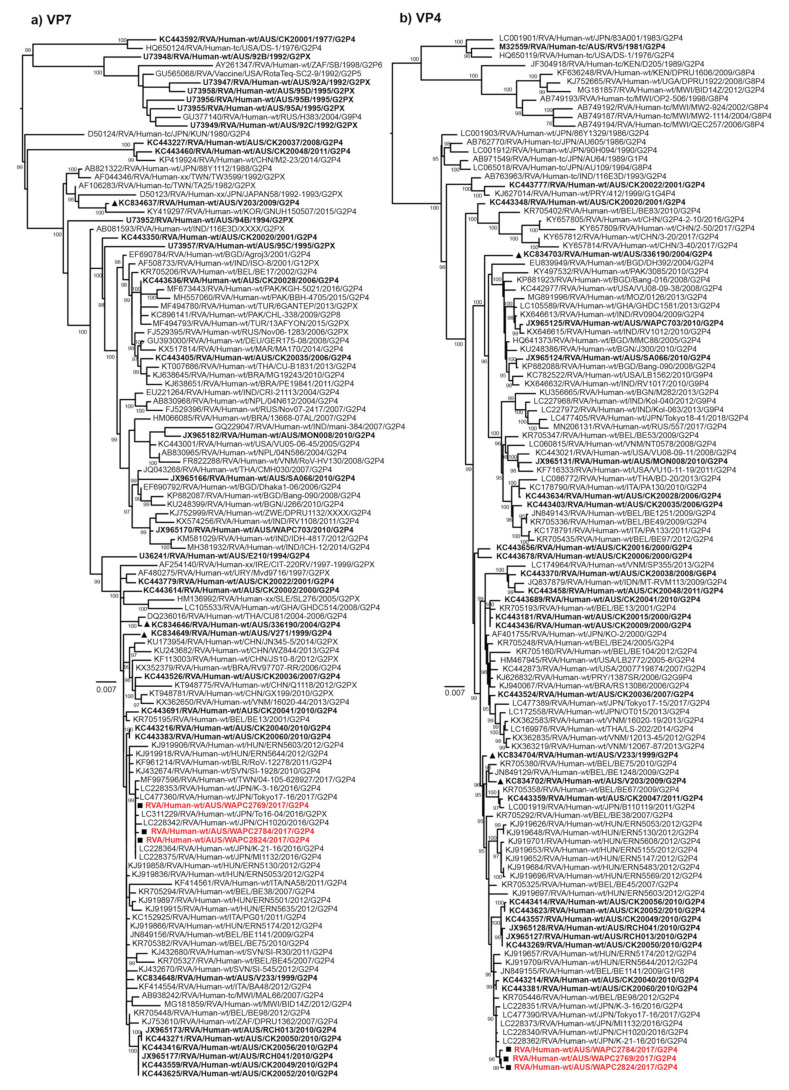
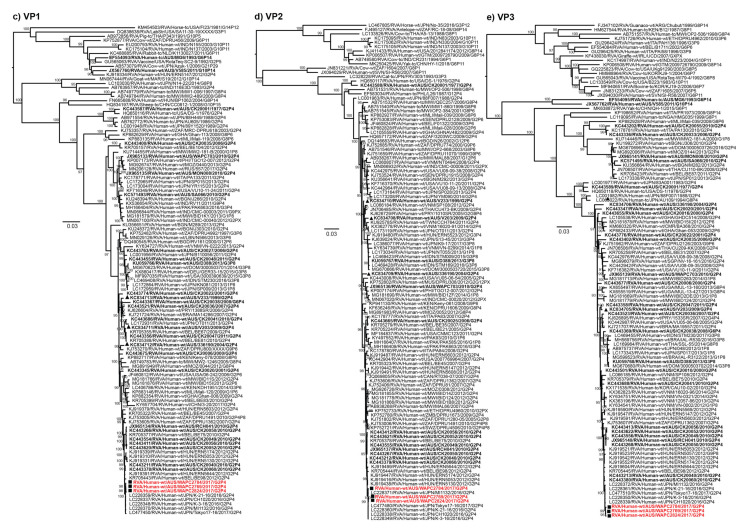
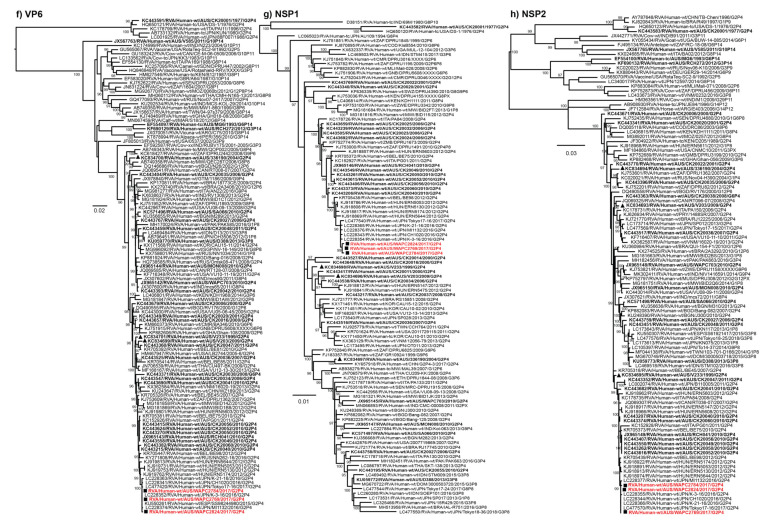
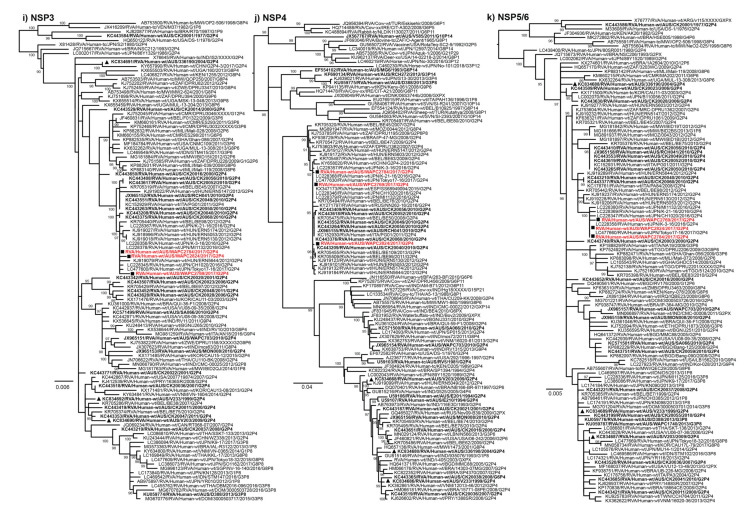
Maximum likelihood phylogenetic trees of (a) VP7, (b) VP4, (c) VP1, (d) VP2, (e) VP3, (f) VP6, (g) NSP1, (h) NSP2, (i) NSP3, (j) NSP4, and (k) NSP5/6 2017 Western Australia outbreak G2P[4] samples. The position of strains sequenced in this study are highlighted in red and with square symbols, previously characterised G2P[4] outbreak samples from the Northern Territory detected in 1999, 2004, and 2010 are denoted with triangle symbols. All Australian samples are in bold. Ultrafast bootstrap values ≥95% are shown.


