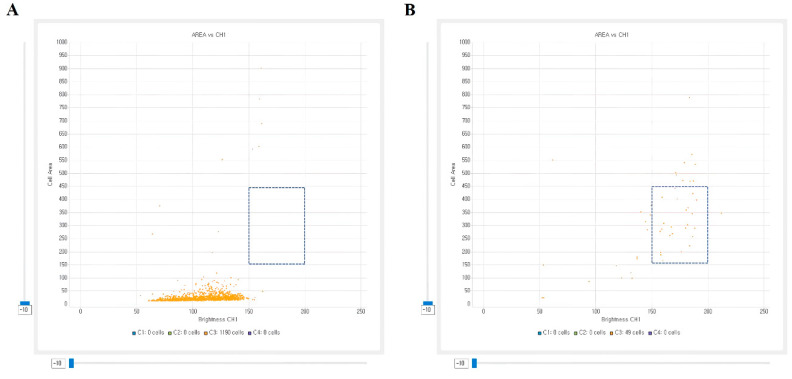
Figure 3.
Scatter plots illustrating parasite signal area and SYBR green I intensity level of P. falciparum positive sample (A) and P. vivax-infected patient sample by automatic malaria parasite detection system (B). The Cell Area refers to area in pixels and Brightness CH1 refers to signal intensity of SYBR green I. P. vivax shows more different parasite developmental stages, such as trophozoites, with lager area and higher intensity compared to that of P. falciparum.

